 |
| FB |
Showing posts with label Month High Volume. Show all posts
Showing posts with label Month High Volume. Show all posts
Sunday, November 3, 2013
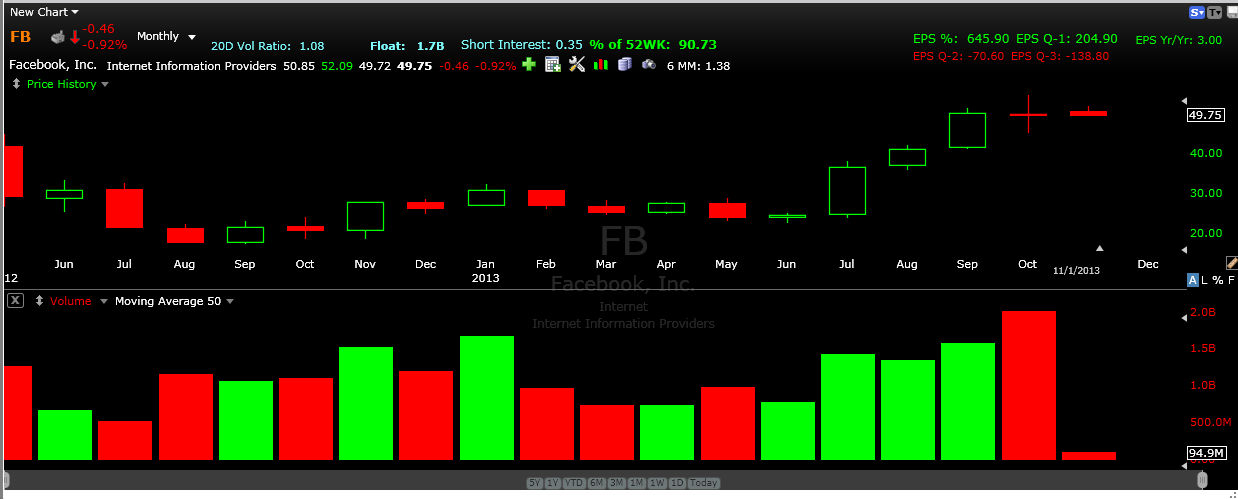
FadeBook?

Thursday, October 31, 2013
YELP, I Need Somebody
During this past month I returned to
the classics and have spent some time rethinking what I learned from
Livermore and Wyckoff in particular. I find great value in reading
the same book 10 times in a row, however I often find greater value
in returning for the 11th reading after time has passed and experience
has been gained, even if it is one sentence or a turn of phrase that
resonates. As it is the end of the month and I am reviewing a number
of charts, I had a sudden connection between one of them and a
concept I've been pondering as of late, the Three Wyckoff Laws.
The three laws are as as follows:
The Law of Supply and Demand: When
demand is greater than supply, price will rise to meet this demand,
and when supply is greater than demand, price will fall until it has
been absorbed.
The Law of Effort vs. Results: Every
action must have an equal and opposite reaction. Price action on a
chart must reflect the volume action below and the two should always
be in harmony. Divergences and disharmonious price and volume often
presage a change in direction.
The Law of Cause and Effect: In order
to have an effect there must be a cause. Further, the effect will be
in direct proportion to the cause. In other words, a small amount of
volume will result in a small amount of price movement and a large
amount of volume will result in a large price move.
One chart that stood out today when
doing one of my month end scans was YELP. I wanted to keep the chart
clean so I kept it sparse with 4 points of interest in this analysis.
 |
| YELP |
The green line is the high of the IPO
date in March 2012 that was unbroken until May 2013 at point 1)
1) My philosophy about IPOs that
I've adopted from Dr. Wish is that the break of an all-time-high
after 3 months is a significant price point. Given that this took
well over a year adds to its importance. That it did so on the
highest volume on a monthly basis outside of the IPO debut
strengthens the validity of it. Filtering this price volume action
through the three laws I walk away with the following thoughts:
Supply and Demand: There is a
supply/demand imbalance here as price is rising
Effort vs. Results: Is there harmony
between price and volume? To verify this two questions to ask is what
is the width of open to close and high to low. If there is effort
which in this case the largest volume over the past 12 months, then
there should be an equivalent result, a candle with a wider range
and a close nearer the high
Cause and Effect: For the month of May
2013 there was a 14.5% appreciation in price from the previous month.
To verify whether this is harmonious action it is important to view
the relationship to the preceding months. November 2012 established
a pivot low that stood firm and on a percentage basis May had the
highest price appreciation and the highest volume thereafter.
2)
Supply and Demand: There is a demand
imbalance as price is still rising.
Effort vs. Result: Is there harmony
between price and volume? In this situation price closed well below
the high, however there was also a large gap up which on a monthly
chart will be rare because the gap can only occur on the first day for this to be so. In essence this can be viewed as strong but also
cautionary action which switching down to lower time frames could
give clues about.
Cause and Effect: As this is the
highest monthly volume of all time there should be corresponding
price action which in this case is verified by the closing up 24% from
the previous month which at one time was a much higher 36%.
3)
Supply and Demand: Price closed higher
so there is still a demand imbalance
Effort vs. Result: Is there harmony
between price and volume? In this situation there is obvious concern
as the difference between the open and the close is only 39 cents.
Further there are wicks high and low suggestion indecision on the
part of traders at this price level, so the consensus as of now is balanced. Given the volume and price action, is balanced what one would expect to see in this effort vs. result situation or is this a red flag even though the candle is green?
Cause and Effect: This is the largest
volume on a monthly basis in the trading history of YELP and yet
price only appreciated 2.37% on a closing basis. Therefor this is an
anomaly and not the expected price effect given the volume cause.
The float turned over 3 times so this churning may very well be
distribution from strong hands to weak hands and reason to be
cautious and on alert for declining prices moving forward.
One of the things I've learned from
going back for the 11th time is being more observant of the price
action on higher time frames and approaching the price/volume action
without prejudice and with a set of rules for interpretation. After
all, price and volume are just data points and a chart is an
abstraction of them, nothing more or less. My knowing that this chart is YELP elicits certain responses and biases that are difficult to ignore, but in having a process and filtration system some of that can be alleviated. Based on the evidence I'd say there is reason to be on watch for a change in character and direction for YELP.
Thursday, October 17, 2013
I'm With These Guys
There's an old adage, you are only as
good as the company you keep. When it comes to my trading I've come
to the conclusion that I want to be with these guys.
 |
| NBG |
 |
| RVLT |
 |
| SCTY |
More and more I focus upon trading
plans that put me in the company of these guys and honing how I can
exploit this on my time frame. These guys be found on the daily,
weekly, or monthly charts, but they have tendencies and nuances
that are particular to the time frame referenced. A recent example
is a previous post about my trading plan for RVLT. A current trading
plan is one I drew up a few days back for SCTY.
 |
| SCTY Model Book |
Going into the last half of the month, 53 momentum stocks are currently running at their highest 12 period
volume on the monthly time frame. This is my hunting ground for some
more of these guys. These Guys (Finviz Screen)
Tuesday, October 1, 2013
Month High Volume Revisited
Is it volume which causes price changes, or do price changes cause volume –the hen or the egg, which came first? -H.M. Gartley, Profits in the Stock MarketTo use a homely analogy, volume is to the price movement of stocks as gasoline is to the automobile. If you step on the accelerator of your car, giving the motor more gas, the car will start to travel faster. The more gas you feed it, the greater will be its momentum. Now, when your car has acquired considerable momentum, if you throw the clutch out and coast, your car will travel a considerable distance on the acquired momentum. -Richard D. Wyckoff
The current consensus is that high
frequency trading accounts for 70% of the daily market volume on the
surface and below the surface it is estimated that dark pools
accounted for 32% of the trades in 2012 and this has most likely
increased in 2013. As retail traders it is important to understand
the implications of this, particularly in smaller caps and stocks
that trade a few hundred thousand shares a day and assess who is on
the other side of our trades and how this effects our price
potential. If there is an average of 200K shares traded and 70% of
that is HFT, this leaves a pool of 60K shares for day, swing, and
positions traders, both professional and retail.
There are both positives and negatives
to this. One major positive is that when these algos run amok and in
our direction they can rapidly push price in our favor. This works
best if one is already positioned in the stock. A counter point
negative is that on entry day this can cause price to move beyond a
proper risk/reward price point and also has the effect of deeper sell
offs into the close or lack of follow through the next day because
the demand is mostly manufactured and the absorption of supply is
temporal and mainly intraday. Another negative is that the supply
remaining can be easily moved by a small group of day traders taking
a position then blasting it out to their 10,000 twitter followers.
We can bemoan this effect or we can
realize from historical study that there always has been and always
will be disadvantages presented to the average retail trader along
with the standard risk of trading that applies if the game were fair.
Although this is the case, the underlying fundamentals of market
mechanics remain the same to this day and the same edges, anomalies,
and patterns of 100 years ago work today. One significant change
that has occurred, however, is the underlying internal market
structure. Darvas spoke of abnormal weekly volume when shares traded
exceeded 50 thousand, but the market has become much larger and the
vast majority of the stocks in my universe trade more than this on a
daily basis. Another fundamental shift is that during Darvas' time
the majority of trades were transparent and there was not an
informational edge when it came to price/volume relationships, unlike
today where the order flow is algo driven or often hidden resulting
in a lack of complete information and therefor a disconnect between
price/volume.
When I started my studies of volume a
year ago I was well aware of the perspective that “Only price
pays.” and that volume was not particularly relevant or useful any
more due to distortions and off market exchanges taking place. Hell,
I even had a hard to reconciling the value of volume and its
importance to myself. But, what is often left unreflected is that
while price may pay what is the price being paid in the first place
and is it an honest price, for not only does a significant amount of
volume go unregistered, the prices being paid does as well. And even
though I was aware of the statistics and effect of HFT and dark pools
I continued to move forward with my line of thinking because volume
has to matter after all because along with the open, high, low,
close, it is the only other piece of information available.
As a result of these studies and
realization of the effect of HFT and DP I've made the decision to
move up to higher time frames, particularly the monthly when it comes
to my volume studies. I started doing this 6 months ago and now have
a model book of the best performing stocks during this time based
upon this metric and have been able to improve my criteria for
vehicle selection based upon the greater clarity this time frame
gives when it comes to quantifying the absorption of supply. Once
strong hands accumulate the float the expectation is that the clutch
can be thrown into neutral and price will continue its acceleration
as the shares that remain come at a premium.
 |
| March Momentum/MHV Watch List: 19% of list increased 50%+ |
Another change I've made to my trading
over the past year is to my entry and time stop. Unless there is a
compelling reason to enter a trade off the open I will wait until
the last hour before making my decisions. There is a trade off as
mentioned previously in which I will forgo some of the algo driven
potential, however I also get to see if my signal completely forms
and price is not faded and sold off hard into the bell. A second
modification I made is extending my holding period from 3-5 days to
10 days to account for the lack of immediate follow through I've
witnessed on my trades. This has allowed time for price continuation
on its terms and has reduced the amount of churning trades by exiting
trades that were not above entry price after 3 days.
It takes time for positions to be built by large players and I've found that by moving up to a higher time frame and following momentum stocks with large monthly volume I'm better able to track rapid price increase with underlying supply absorption. A periodic review of this list to prune those with waning momentum or decreasing price is sufficient to keep my watch list actionable with the greater confidence that I am on the correct side of the order flow for my time frame. The debate of which is more valuable or important or came first I'll leave to others as long as I have a hen that lays eggs I can eat.
Thursday, August 1, 2013
Float Turnover Analysis
On any given day there are only 5 pieces of information given by stocks, the open, the high, the low, the close, and volume. This is the skeletal structure of the market from which numerous calculations and abstractions have been fleshed out as a means of giving traders a clearer view and understanding of the underlying structure and essence. It’s almost as if there is a constant pursuit to get further and further away from price and volume, but the farther one travels away, the smaller the observed object becomes until eventually it disappears from sight altogether.
For the past year I’ve been increasingly focused on price/volume relationships and what I’ve found bemusing is the often times polarizing debate around the significance of the only two pieces of information the market gives. There’s an argument that only price matters since only price pays and on the flip side there are arguments along the lines of price without volume is suspect. There’s a number of variations on this theme, but the resoluteness with which each side speaks comes across as if the chicken or the egg has been solved.
So, which is it? One of the few structural edges in the market is momentum. It has been shown that by calculating a price rate of change over 3, 6, and/or 12 month periods and ranking these by baskets, that the top 10% will outperform the next 10% which outperform the following 10% etc... From this we can state that in order to have an enduring edge in the market all one needs to trade is price.
However, the old adage that price follows volume can also hold true as well, but from my perspective in order for this to be more effective price must be lacking momentum in the first place. This makes sense empirically for if price is already rising and the momentum effect has already kicked in, then this in and of itself is sufficient for expectation of higher prices in the near future, whereas if price is in neglect and volume historically anemic, then a spike in volume can put one on alert that there is a potential supply/demand of the underlying stock occurring as stronger hands begin their accumulation period.
Two recent examples I’ve noted have been WLT and FB. Walter Energy has clearly been in a downtrend for the past three years and is in the range of historical lows which is an indication of neglect. Currently price is showing no signs of a momentum shift, but it may be showing signs of a supply/demand imbalance. A glance at the weekly with attention on volume suggest this.
 |
| WLT |
Facebook has been a pariah since its IPO, but any left over disdain for this stock should be thrown out with the bathwater. Since its debut, price continued a descent which erased nearly 60% of the value over the next 4 months. There were some indications that a bottom may have been in place around the $18 range, but the November 2012 momentum phase stalled and the action since has been mostly range bound. On July 25, an earnings catalyst propelled price 30% on volume that was about 20% of the float. In conjunction, momentum on a 3 and 6 month period kicked in as well.
 |
| FB |
There’s a concept called float turnover ratio analysis which is the study of volume relationship to a stock’s float and the amount of turnover in a given period. One of the inherent problems with this is that it can’t be easily replicated. I’ve found no public source of information and my scanning programs do not allow for a stock’s float to be used in calculations. Seems to me the only option is building and maintaining a database, but the time consumption of daily maintenance and upkeep as well as accuracy of source has been a hindrance, so I’ve opted to make due with what I have.
At the end of each month I run a scan that looks for the highest volume over a 12 month period, and at the end of each week I run a scan that looks for the highest weekly volume over a 2 year period. One of the things I’m looking for are the outliers that stick out like sore thumbs and come close to or eclipse the stocks float, especially when followed shortly thereafter by momentum.
Friday, March 29, 2013
Pump Up The Volume, March Edition
For the past few months I've been doing
studies and analysis of volume and ensuing price reaction. I've
added a small wrinkle to my process that I'll do at the end of each
month and create a watch list of momentum stocks that show the
highest volume on a monthly basis compared to the past year. A scan
through my Telechart universe gives 187 stocks above $3 in price with
momentum based upon 3-month period.
There's a couple of things I'll be
doing with this list. The first is to go through each chart and
check for commonalities to model and to check whether or not there
were clear set-ups as I define them and if not, what I may need to
adapt regarding my entry signal. The second I've done is broken them
down into categories as a means of refining my vehicle selection.
The first category is sorted by sub-industry to look for a common
theme and find out what industries are attracting the most volume
interest. The second category is sorted by price percent change over
30 days and taking only those that have made an increase greater than
a 20%. The third category is sorted by All-Time-Highs as filtered through my watch list (which may or may not still be near their highs). The fourth
category is IPOs that have traded between 6-11 months and sorted by
those that have had the highest over a 6 month period.
Subscribe to:
Posts (Atom)