Back in November I wrote an article displaying the SPY chart, in part because all of my other charts were beginning to get a little messy and in part because I wanted to note price action over time without interference on and redrawing boxes and trend lines to suit my fancy of the moment. So today I've decided to draw a trend line extending from the peak of the last box I drew on the chart. It's clear that there hasn't been much progress in either direction and it is also become clearer that another range has formed.
 |
| SPY 12/09/11 |
One of the significant distinctions to note between this range and the previous that began in February is the volatility. The range from February through July was –in comparison –quite orderly, while the current range since August has been quite erratic with very wide range bars and numerous gaps and a lot of emotion. News and Macro events have played a significant part in both ranges, but the bad news during the current phase isn't being shaken off so easily, and if we're to take the stance that markets are forward looking, the current consensus doesn't appear to believe this will be improving any time soon. It hasn't exactly degraded either.
One of the indications that events are being priced in to the up side will be a decreasing in volatility and compression of daily ranges. As of now, 2% down days followed up 2% up days are still consistently the norm. As mentioned in the Zanger article, bear markets slide down the slope of hope and this can be noted by the contempt, frustration and disgust of every 1%+ down day being quickly forgotten through the excessive optimism of the following 2% up day being the one: the one that ends, the cracks the bear market, the one that leads to a life time of riches, the one that makes all the toil worth while –that one.
Looking at what's led this week yet again, I don't believe that yesterdays move, or any of the 2%+ moves as of yet have been the one. Yet again, it's the JOB stocks getting squeezed like oranges leading this week:
 |
| Top Gainers Week of 12/09 |
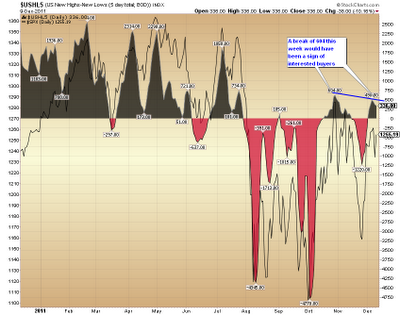
Further, the inability of the $USHL5 to clip the previous peak of 604 sends a strong signal that there is a lack of leadership in this move. There are definitely some quality stocks holding their own but there aren't enough of them just yet to indicate a difference in the mood of those that have the capital and means to move markets with their buying. I would argue the point that the primary reason this showed any gains at all this week is a lack of new lows due to bottom fishers and a bump in highs due to the dropping off of previous highs.
 |
| $USHL5 12/09/11 |
Currently the market is fleecing both longs and shorts as neither side has been given the green light of conviction to push their positions. Most indexes have neither made a new high since late July nor made a new low since early October. Taking positions in either direction right now is akin to being a Lima been in the mouth of a four year old- a high probability of getting chewed up and spit out. Right now patience truly is a virtue.
No comments:
Post a Comment