Showing posts with label Weekend Review. Show all posts

Sunday, September 8, 2019

Weekend Review 09-08-2019

Stabilization
Over the past couple of weeks stocks have shown stabilization.  Much of the damage that began in early August hit peak declines by mid.  During this period there were a handful of days with significant breakdowns, but since August 23rd breakouts have been accumulating.

Breakouts/Breakdown

The number of breakouts over this time period has been consistently positive and expanding more frequently to the upside than the down side.

10 Day Buying - Selling


Highs across multiple time frames have positive traction.

New Highs/New Lows
After a period of flat lining the number of stocks in my 3 month momentum scan have shown a slight uptick.

Momentum Universe


Ideally these metrics will continue to improve.  Continued green shoots across multiple time frames.  More breakouts than break downs.  Expanding new highs.  Expanding tradeable universe.  The next piece of the puzzle to begin to determine aggressiveness in this market is to see the magnitude of moves over three months expand.

Expansion of Stocks > 25% over 3 Months

Expansion of Stocks > 13% Over 6 Weeks

Sunday, March 10, 2019

Weekend Review 03/10/2019

The underlying structure of the indices makes it improbable for them to undergo a high momentum phase.  If they do it indicates the underlying buying  is not only broad based, but demand is exceptionally high resulting in rapid price appreciation over a short period of time.  These periods are not sustainable and tend to result in sharp pullbacks.  This past week the major market averages have pulled in, but not enough for all them all to unwind.

SPY Exits High Momentum Phase
COMPQ High Momentum Phase

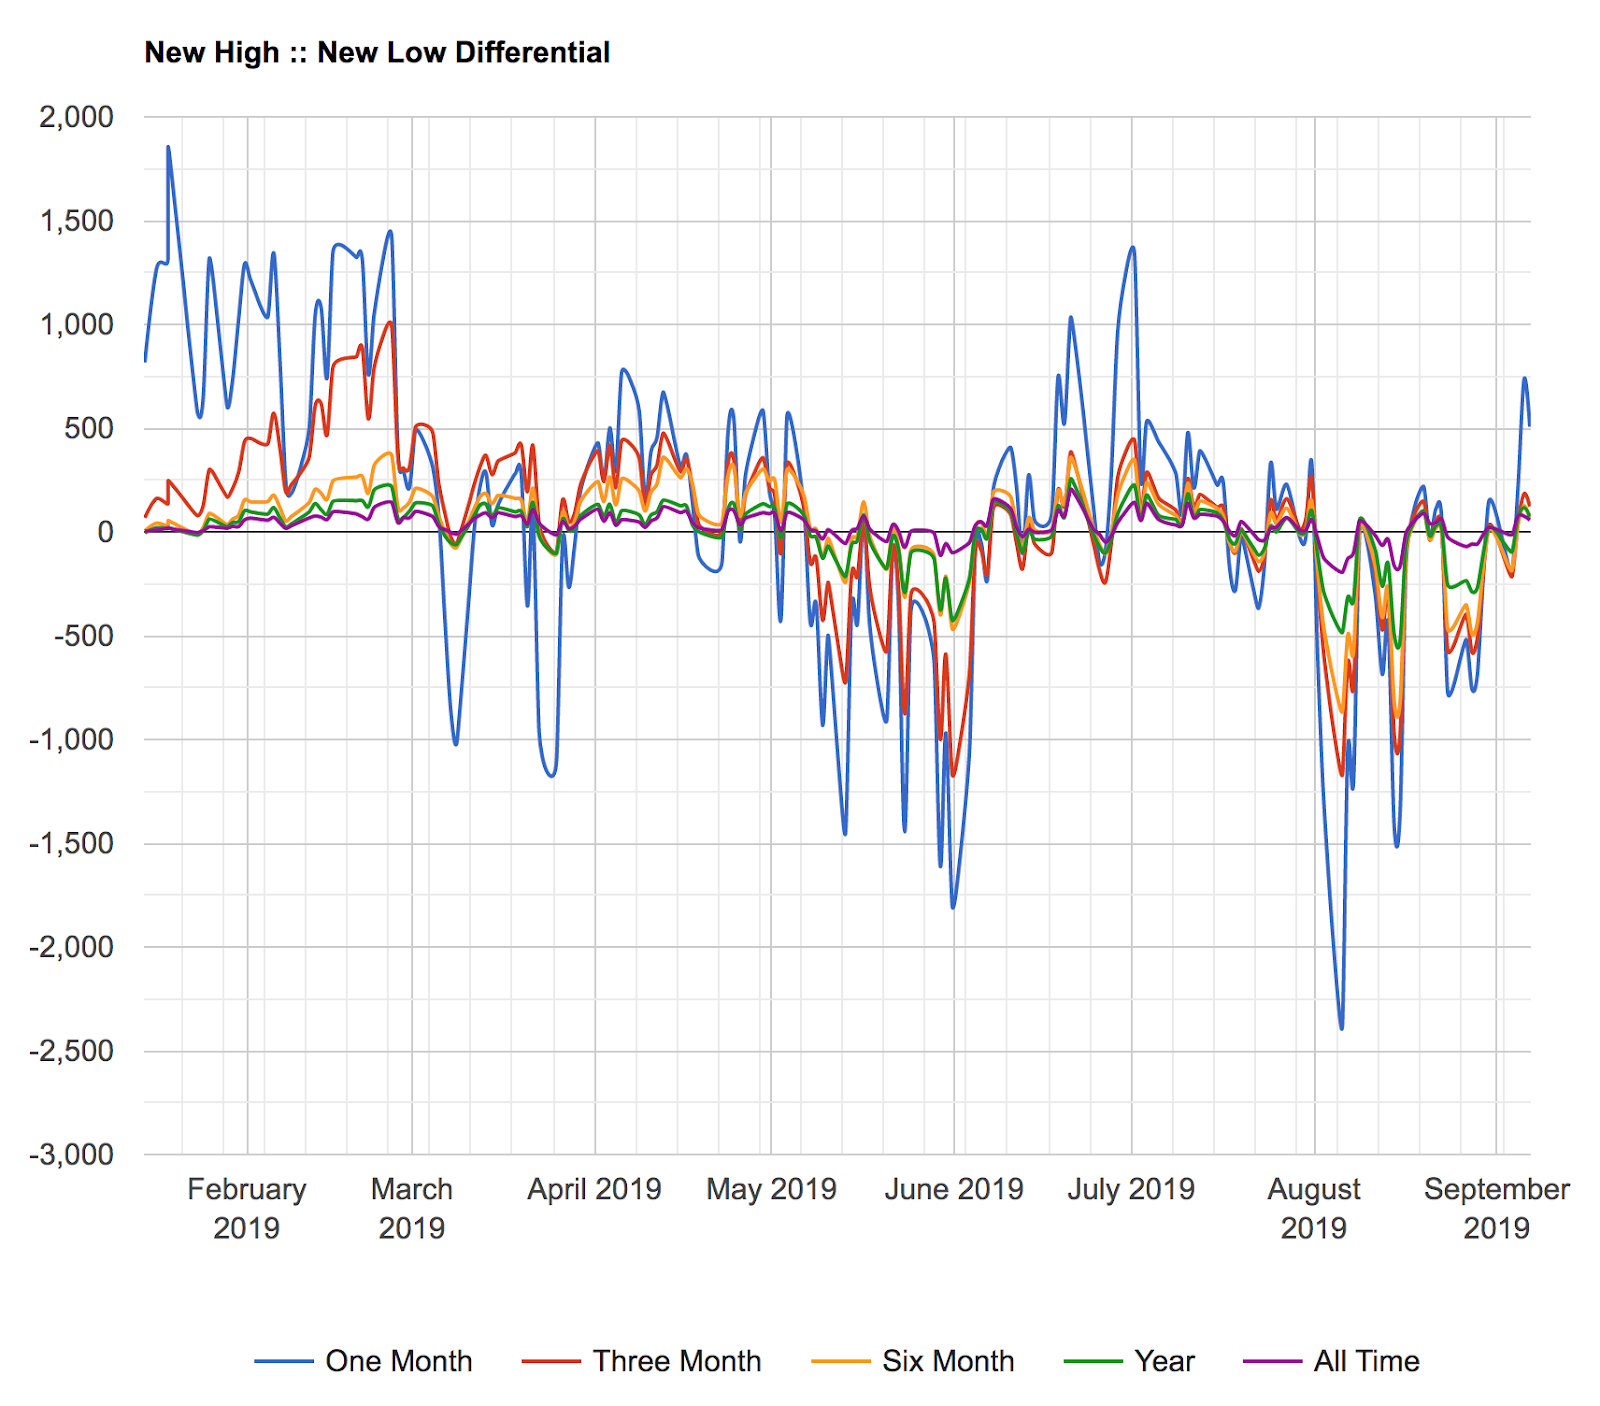
The selling pressure over the past week has inverted new highs to new lows across multiple time horizons.  


New Highs - New Lows


The number of stocks above their 20 period moving average has unwound to a level where it is becoming extended to the downside.

%Stocks > 20 Period


T2018
T2108, the percentage of stocks above their 40 period moving average has unwound from extended levels and pulled back to ~50%.

Of note is that the number of stocks that have made moves of greater than 13% over 6 weeks is close to flipping.  It will be worthwhile observing if this hits higher time frames.

Stocks > 13% 6 WKs

Currently I'm approaching this as a pullback within an aggressive breadth thrust.  I expect a pause as new setups emerge.  Until things firm this is a risk management market.  Being attune to when stocks stop making new lows across multiple time horizons and when buyers step back in will be a primary focus.

Monday, January 21, 2019

Weekend Review: January 18, 2019


It only took the major indices three weeks to accomplish what typically takes a year.  From deeply extended breadth conditions to the downside that culminated in a correction ranging between 20-25%, the indices snapped back ~15%.  


COMPQ 01/19


When the markets are down it’s beneficial to look for the positives.  When they are up it’s beneficial to asses what the negatives might be.  Historically it is not uncommon for indices to snap back following a significant leg down before sellers dominate again.  Whether this scenario plays out remains to be seen, but what is evident is that on a shorter and medium time horizon, stocks above their 20 period moving average are overextended to the upside, and the percentage of stocks above their 40 period is at a cautionary level.


%NYSE > 20MA

%NYSE > 40MA


Moves like this are unlikely to be sustainable, and in the least some form of pullback or sideways consolidation should be anticipated.  How much selling hits the tape and the manner in which stocks behave moving forward during the next two will clarify matters.   

Sunday, December 16, 2018

Small Caps Encroaching on Bear Territory

This week the S&P, IWM, and NYSE established new pivot lows.  IWM has now corrected ~18% closing in on the 20% bearish threshold.  

SPY Weekly
IWM
NYSE

NASDAQ Composite low from 4 weeks ago has held thus far but has broken below 15% again.  Time heals all markets, and with earnings season 4 weeks away the market may continue to drag until stock specific catalyst renew participation.

COMPQ

Sunday, November 25, 2018

Weekend Review: 11/23/2018


Between 1980 and 2018, the U.S. markets experienced 36 corrections. During this time, the S&P 500 had fallen by an average of 15.6 percent. Ten of these corrections resulted in bear markets, which are generally indicators of economic downturns. The others remained or transitioned back into bull markets which are generally indicators of economic growth and stability.
The average market correction is short-lived and lasts anywhere between three and four months. 
Investopediahttps://www.investopedia.com/terms/c/correction.asp


Using the week ending October 5th as a start date, the general market averages have corrected ~15% across the board with a duration of 2 months.  Should the market continue in corrective mode within its average range and duration, over the next few weeks some stabilization in the underlying structure of stocks should be expected.  Coupled with the next two months having a positive bias it's my perspective to begin focusing on the positives.

Recently the Nasdaq Composite undercut a key pivot low established earlier in this month.  The price action did not look like a capitulation type shakeout which is not unexpected given that it occurred over a holiday shortened week.  With a full week of trading ahead, I'll be observing whether this low is undercut with volume or a second index such as the S&P undercut their pivot low.

COMPQ WEEKLY

SPY WEEKLY
NYSE WEEKLY
IWM WEEKLY

Stocks above their 40-50 period moving averages are extended to levels infrequently witnessed.  

T2018
$NAA50R
$SPXA50R

Stocks decreasingly making new lows across multiple timeframes.

One Month Lows

Three Month Lows
Six Month Lows

$USHL5

Percentage of stocks making moves of 25% over a quarter at 2 year lows.  This correction has clipped stocks across the spectrum leaving few untouched.

Trading Universe Up/Down 25%

The magnitude of downside moves over a six week period has stabilized.

Stocks Down 13%+ Over Six Weeks

Damage to stocks has been sweeping during this correction.  Time will tell if this becomes a full blown bear market for stocks or just a near annual 15% correction over 3 to 4 month period.  To me, when stocks extend breadth to the downside with levels that are rarely seen it is time to begin to accumulate the positives.  Extended breadth to the downside indicates that the balance of probability lay with the upside, but this is not a certainty.  Having a filter of how stocks are expected to act over our time horizon helps confirm alignment. 


My expectation is that at some point a broader number of stocks will show patterns and characteristics that meet my set up criteria, a broader number will begin to populate momentum scans, and a broader number of stocks will move my historical norm over my average holding period.  The market will either confirm this over the next 4 weeks or not.

Sunday, April 16, 2017

Weekend Review 04/17/2017

There is sufficient evidence to indicate that the general market has been correcting through time.  The issue I see moving into the next couple of weeks is will this translate into a correction through price?  Market breadth trends are weak enough that I considered it worth taking the short side through an exploratory position in the SQQQ and TZA.  The charts offer a clear line if I'm wrong and a clear line of confirmation if I'm proven correct.  With earnings season beginning on the 24th I expect one of these sides to resolve.

One of the breadth trends I pay attention to, the number of stocks over a ten day period that have had more break outs to break downs has been mostly flat to slightly negative.  It's much simpler to trade a stock market than a market of stocks, and the later type of market has been the dominant force over the past month.

Buying-Selling

On a higher time frame, one of the breadth metrics I tally has been predominately negative over the past month.  So, not only is buying to selling been hovering in more of a trough zone than peak zone, on a higher time frame this has been even more pronounced.

Secondary Ratio

One time frame up the story is becoming consistent across three time horizons.

Primary Ratio

Earlier this week I posted three charts using a GMMA and 2-Month momentum time frame on the IWM, SPY, and QQQ noting three distinct periods that I assess as prime for aggressive trading, cautious trading, or short oriented trading.  By the close of this week all three indexes have shifted to short oriented trading.

IWM

SPY

QQQ

This week also closed with with expanding lows on a one and three month time frame which is close to flipping across all higher time frames as well.

New Highs : New Lows

This week I also took some notes regarding the IWM, SPY and QQQ.  The critical price zone that I am paying attention to is the recent local low.  A break below this low and I fully expect the market to begin correcting through price.  My expectation would be 5-10% retracement from recent all time highs.  A break out above the recent lower high is where I consider my assessment to be incorrect and opposite the markets potential.

IWM

SPY

QQQ


The current market structure is beginning to shift from ambiguous to clearly negative.  Personally, I find weak markets untrustworthy.  Not only are they difficult to trade, but in addition weak markets have the potential of having the rug pulled out from under them.   Perhaps earnings season will be the catalyst and spark to renew the upside, but any misses will be severely punished and could be potentially infectious.  From my analysis the market is offering an opportunity to the short side with a break of the recent lows as confirmation and perhaps the path of last resistance trade.

Saturday, April 8, 2017

Weekend Review 04/08/2017

This weekend I decided to revisit an old chart template representing a trading idea I had long ago to see if my perspective has changed, there is something I understand now that I didn't gleam then, or if it is wroth considering given what I know now.  One concept I never underestimate in trading is that it takes time to find one's time frame as well as constant reevaluation of previous ideas to see if what was muddy waters is now morning coffee.

The system I devised was a trend trading concept based upon two signals, a Guppy Multiple Moving Average cross over coupled with a two month momentum indicator.  From these two signals I documented three zones: green for aggressive trading, yellow for cautious trading, and red for avoidance or short oriented trading.  The green zone consisted of positive momentum and positive GMMA.  The yellow zone consisted of three potential signals:  a transition from positive to neutral momentum, a GMMA flip while momentum is positive, or a positive GMMA crossover with waning momentum.  The red zone is waning momentum with a negative GMMA crossover.  When momentum itself inverts this suggest severe market weakness.

One of the things that has held me back from implementing this is that I have yet to be able to marry a holding period with a reasonable position size and stop to allow for the weeks to months required for a trend to unfold.  Regardless, it is still an idea that I return to every so often and take notes of for future reference.  Something that stood out for me this weekend, though, was that it actually translates well with breadth metrics, divergence, as well as strength and weakness.

QQQ


First up is strength.  Based upon the analysis criteria, the QQQ is in a zone of caution.  Taken from a positive, the only detriment is waning momentum.  Neither has the GMMA flipped nor momentum turned red.  I see no evidence from this chart that there is much to be overly cautious about.  However...

SPY

The S&P is suggesting a more confusing narrative.  For one, there has been a GMMA flip from positive to negative to positive.  These flips were concurrent while momentum is waning.  Also, the frequency of horizontal bars has is higher over the last two months.

IWM

The IWM is showing the worst of the lot.  Over the past few months momentum has been in a zone I quantify as neutral, there have been multiple GMMA crossovers, and the frequency of horizontal bars is the highest of the three indexes as ETFs.  Given that this index is considered to be the geiger counter of riskiness of market participants, the current consensus a belief of risk off.

So... from a breadth perspective I'm beginning to see the value of this analysis.  There are clean points of quantified reference indicating distinct periods of aggressiveness as well as  long, short, or neutral bias.  There are also clean references when one index is outperforming the others as well as distinctions when it's preferable to rotate into one or the other for long/short or both.  Now to throw it back into the cookie jar and see what I think down the road.

Sunday, April 2, 2017

Weekend Review April 02, 2017

What looked like a significant break to the downside on Monday turned into a non-event by close.  The general market averages drifted upward through Friday's close negating much of my expectation of market direction coming into the week.  While I considered a flat market I was leaning more towards further downside,  particularly given the action on 3/21 and not really expecting much upside at all.  I've yet to quantify whether or not there is an edge to what is considered to be an end of quarter window dressing, but when the market proves analysis incorrect arguing against can be costly.

Coming into this week I decided to take the perspective of what would make me want to move heavily long as opposed to what would make me perceive a stagnant to downside market.  The first metric I would like to see increase is the number of stocks over my standard holding period expanding over this time frame.  Currently this is still mostly flat lining.

10 Day Buying/Selling Differential

Seeing expansion over a 6-Week time horizon would be the second.

13% +/- Over 6-Weeks
Lastly seeing this expand to a quarterly time frame.

25% +/- Over a Quarter

With a fresh earning season underway perhaps this will be a catalyst to break the current market gridlock and push breadth metrics northbound en masse.

Sunday, March 26, 2017

Weekend Review 03/26/2017

The general market continues to show signs of waning breadth as the number of caution flags continue to increase.  In the least I expect the market to continue to chop in the near term but would not rule out a 5-10% pullback.

One of the main reasons I suspect a pullback in the near term is that the IWM continues to show the most weakness.  Typically when this happens there are two theories of thought: the IWM will rebound and play catch up, or this weakness will begin to spread into the SPY and QQQ.  Assessing a daily GMMA chart the later is becoming evident as the SPY has begun showing waning momentum on a 2-Month time frame coupled with a GMMA crossover.  The QQQ is now showing waning momentum on the 2-Month time horizon but has yet to crossover.

IWM GMMA Daily

SPY GMMA Daily

QQQ GMMA Daily

On a weekly time frame the GMMA for these three indexes has yet to show the characteristics and pattern typically associated with a much deeper pullback.  Until weakness extends to this period I continue to give the overall market a good bill of health and the benefit of the doubt for continued upside down the road.

IWM GMMA Weekly

SPY GMMA Weekly

QQQ GMMA Weekly

Another reason why I suspect any pullback on the near term horizon would be somewhat shallow is that the percentage of stocks above their 200 period average is above 50.  Were this below and declining I would conclude there to be a high probability of a deeper and/or longer term correction looming, but this is not the currently the case.

T2108

The percentage of stocks above their 40 period moving average has yet to reach a zone where sustainable bounces tend to occur.  Market breadth on this time frame using this metric is not extended far enough to the downside for me to become bullish on any snap back rally at this time being sustainable without evidence of buyers stepping into the market with authority and broad based buying.

T2107


Overall I'm not seeing much evidence to become exceptionally pessimistic about the markets potential to the upside, however I'm seeing enough signs to be cautious and lean towards further downside in the near term.  I find it best during times of conflicted signals or changes of character in the market on my time frame to sequester.  These are the times I find it best to keep an open mind, ignore the noise, and focus on the signals.  Always be prepared for which ever way the wind blows, but make sure it's actually blowing.