Showing posts with label Market Breadth. Show all posts

Sunday, September 8, 2019

Weekend Review 09-08-2019

Stabilization
Over the past couple of weeks stocks have shown stabilization.  Much of the damage that began in early August hit peak declines by mid.  During this period there were a handful of days with significant breakdowns, but since August 23rd breakouts have been accumulating.

Breakouts/Breakdown

The number of breakouts over this time period has been consistently positive and expanding more frequently to the upside than the down side.

10 Day Buying - Selling


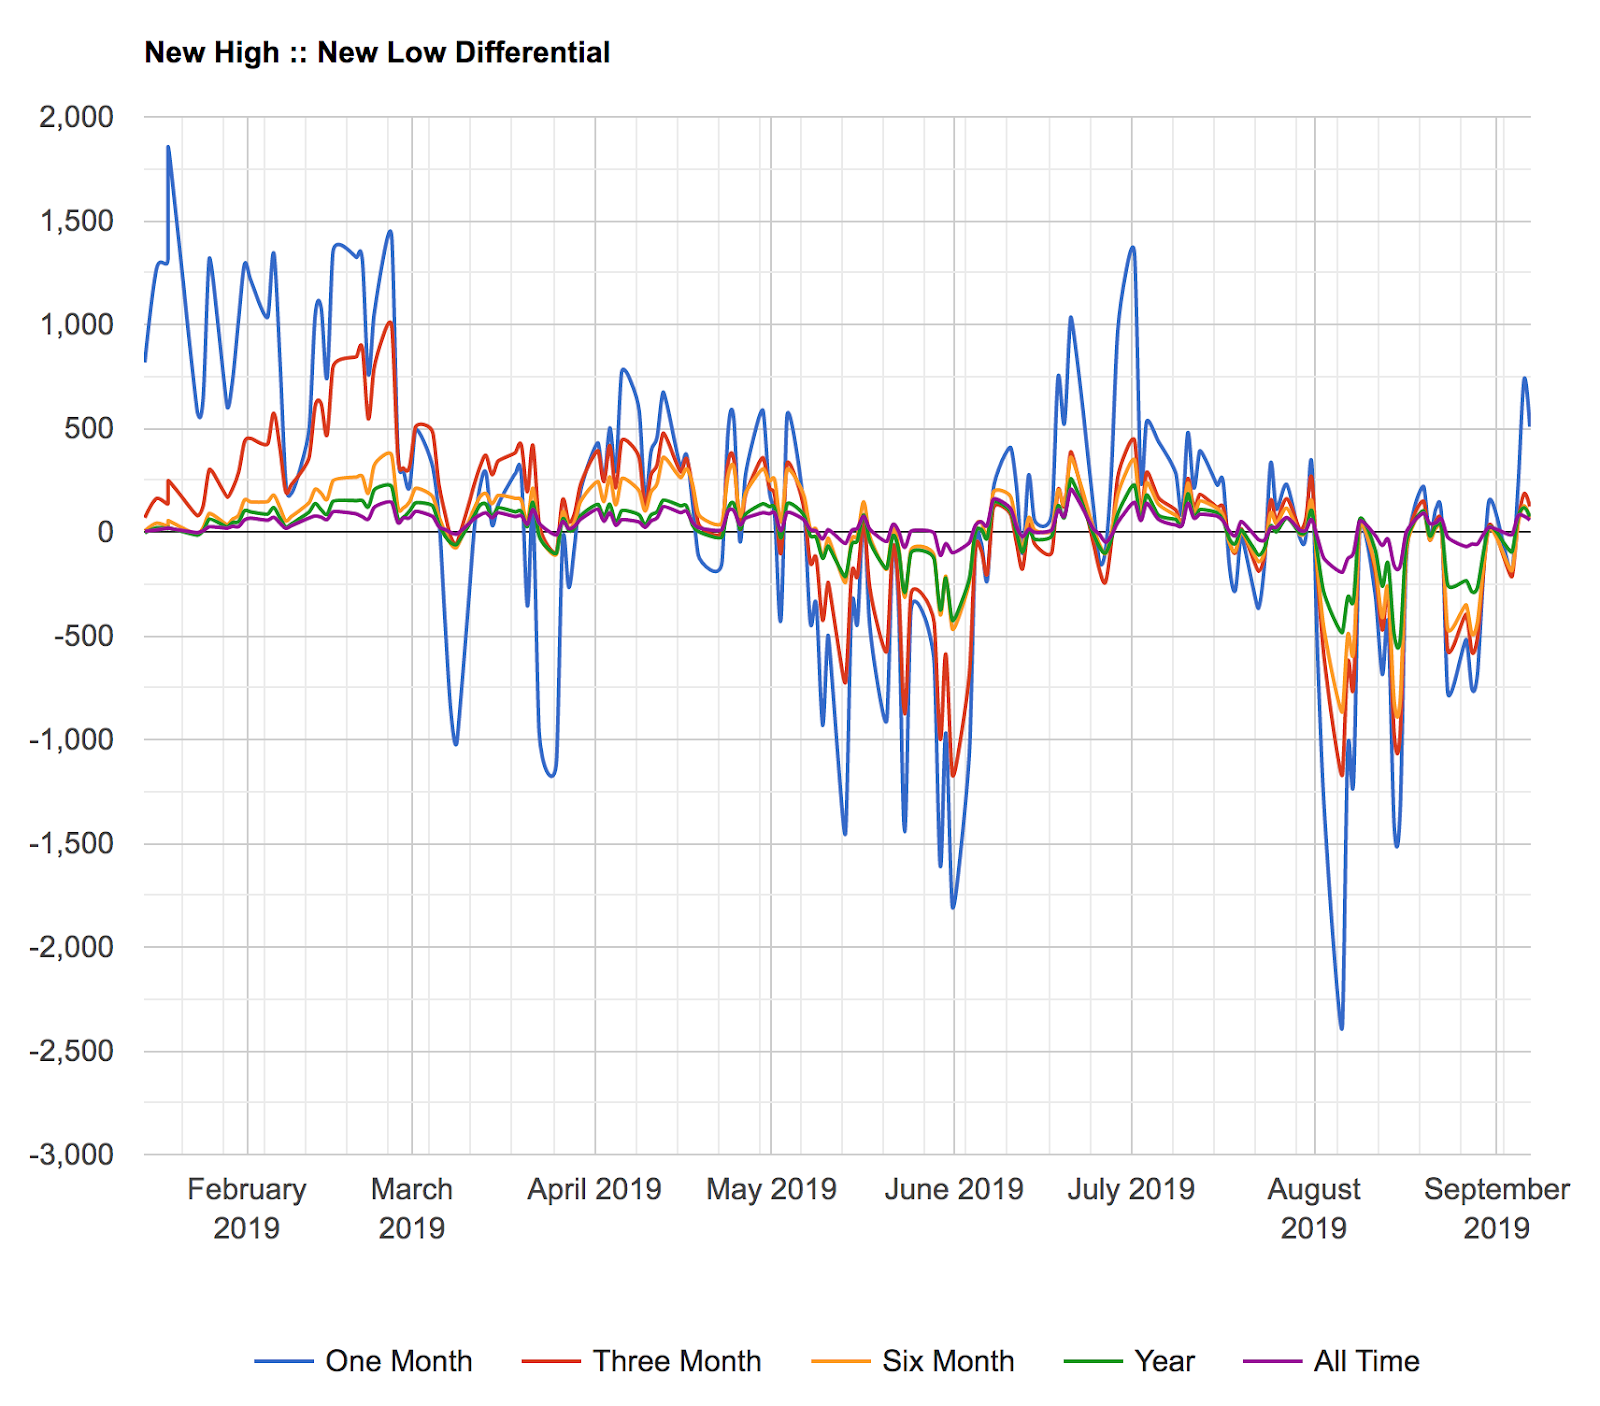
Highs across multiple time frames have positive traction.

New Highs/New Lows
After a period of flat lining the number of stocks in my 3 month momentum scan have shown a slight uptick.

Momentum Universe


Ideally these metrics will continue to improve.  Continued green shoots across multiple time frames.  More breakouts than break downs.  Expanding new highs.  Expanding tradeable universe.  The next piece of the puzzle to begin to determine aggressiveness in this market is to see the magnitude of moves over three months expand.

Expansion of Stocks > 25% over 3 Months

Expansion of Stocks > 13% Over 6 Weeks

Monday, September 2, 2019

August 2019 Monthly View

There are multiple ways to take the temperature of stocks and assess whether they are healthy, suffering a slight cold, sickly, or feverishly unwell.  Given the usual caveats regarding indices and how they tend to lag the underlying vehicles when stocks decline from peaks and rise from bottoms, there are still ways to use them as a thermometer.

As someone who focuses mostly on stocks across a 3 and 6 month time horizon, where the indices are in relation to a 6 month average is important information to me.  As denoted in the following NASDAQ chart, serious corrections in stocks will frequently make a dent on the index over this time frame.

COMPQ 6-Month

Addressing the SPY, a similar pattern emerges.

SPY 6-Month

As of now, the basket of stocks that compose the COMPQ and SPY are behaving in tandem and not visible distressed as of the end of August.  However, the basket of stocks that compost the NYSE and IWM are visibly in tandem with each other and in opposite direction overall when viewed against the COMPQ and SPY.

NYSE 6-Month

What can be visibly and empirically assessed when looking at the NYSE is that during serious corrections the 6 month average will be in decline with multiple closes below.  That going back to 2018 there has not been a new high made by this basket of stocks and they have never fully recovered from their most recent significant correction.

The IWM is showing similarities in behavior to the NYSE. 

IWM 6-Month
Unlike the NYSE however, the correction in the underlying basket that compose the IWM continues to weaken as the monthly close is below a declining 6 month and below the 2 year average.

Coming into September what is abundantly clear is that market volatility and price swings have been the norm in August.  Through it all the COMPQ and SPY have pulled in approximately 7% in keeping with statistical averages.  Stocks that compose the IWM and NYSE as a group have struggled and have gone through 12-18 months respectively without a new high.  The underlying weakness as exhibited by the two indices has not spread further into the stocks that compromise the COMPQ and SPY. 

It remains to be seen if the stocks responsible for the bulk of the moves on these indices continue to do so, dumb down to the laggards, transition through rotation, or the laggards catch up, but what can be seen currently is that stocks are not in lock step to the downside overall.  If anything that is reason enough to remain optimistic unless and until the judgment of stocks tells otherwise.

Thursday, August 1, 2019

Breadth Inversion

A month ago today stocks hit levels of exuberance that generally unwind through price and/or time.  For short term traders this was a warning to be on alert for further deterioration.  Through following magnitude of moves by stocks across multiple time frames, the evidence shows accumulating negatives that have resulted in the acceleration to the downside.  Today this acceleration has inverted readings across multiple time horizons.

Breadth Inversion

Tuesday, June 4, 2019

Green Shoots

Whether the green shoots will flower and fruit remains to be seen but some positives under the surface today.

First there were a decent amount of stocks breaking out today.

Breakouts
New highs over new lows is beginning to trek north bound.

New Highs Over Lows

Currently there are more stocks making all time highs than all time lows.  The number of stocks down across multiple time frames has snapped back as well and there is the potential for a positive cross over across all time frames.
Daily High Lows

For swing trading with the wind at one's back a window may be opening here.

Monday, June 3, 2019

Top of the Pops and The Piano Man

The nature of the beast means the QQQ and the top 5 underneath holdings will ebb and flow in near unison.  Today the top of the pops got hit bringing the QQQ and its top 5 holdings to a near 1::1 relationship.

QQQ Top 5 Holding

In addition the piano man was raked over the coals as stocks that were holding up well had their wings clipped. 

MLAB

PAYC

In addition to MLAB, PAYC, stocks such as: CYBR, ADBE, HUBS, PCTY, TEAM, COUP, ZEN etc...  were dinged hard.

While this was unfolding across many names that have held up well, there is a potential silver lining under the surface.  For one, stocks above their 20 period moving average actually had an upside bump today.

$MMTW

And perhaps more peculiar given the underlying circumstance with high flying stocks selling off hard is the number of highs over lows having an upside bounce as well.

New Highs - New Lows

This may be tapered exuberance in stocks that have held up, particularly in the software sector,  and a rotational move into other industries.

Saturday, June 1, 2019

Selling In May

During the month of May stocks have been under distribution with 50% of the trading days showing more 4% break downs than break outs.  

Distribution
The weight of this distribution is clearly seen with the number of stocks making new highs eclipsed by the number of stocks making new lows over multiple time frames.  However, the pressure on stocks has been evident going back to March.   

Highs Over Lows

When the market correction reversed in late December stocks underwent a significant breadth thrust over a short period of two months.  From that moment further the major indices continued to make fresh highs with underlying divergence in both the number of stocks making new highs and making significant headway.  Market risk was increasing until the dam broke in May.

Decreasing Breadth

With the major indices down approximately 7 to 10% across the board, it's time to focus on a tradeable rally.  The number of stocks below both their 20 and 40 period moving averages are approaching zones where in the least a reflexive bounce is to be expected if not the potential for another leg up.

Stocks > 20% MA

T2108 > 40% MA

On a longer time frame, the current pullback has brought individual stocks in my trading universe back to levels of the December turnaround.  It's uncommon for stocks within my universe to reach these levels further buttressing my belief that the probability this downdraft running out of steam is near.  On the other hand this period could also be like October 2018.  In either case knowing what data and information one is looking for on their time frame to indicate where the market is directional moving over it is the primary determinant factor.

2 Year Breadth Trend


Monday, April 15, 2019

Returning to a Market of Stocks

The past 6 months have illustrated a delineating characteristic between a market of stocks and a stock market.  One metric that bears this out is the percentage of the universe I follow being up/down 25% over a 3 month time frame.

Transition Phase
What this highlights is that within the past 6 months there has been a higher correlation between stocks moving in one direction and just as quickly moving in the other.  Prior to that there were 18 months of a fairly static range where these numbers oscillated but didn't fluctuate much.  From a lower correlation market of stocks there was a transition phase into a high correlation stock market which is now beginning to compress again.

This compression is highlighted on a lower time frame of 6 weeks.

Compression
Market moves over a 6 week time frame have been compressing and this is evident chart wise on a number of stocks that have been mostly flattening over this time period.

The number of new highs and new lows over this period has also shown compression near a zero base with ticks above and below on the longer term time frames.  There has been some fluctuation on the shorter periods but no significant directional burst.  Each time there looked to be it pulled back in.

New Highs/New Lows

Thursday, February 28, 2019

Extreme Momentum on the Indices

It is uncommon for the major market indices to show up in my momentum scans.  It's rarer still when they all do.  The tendency thereafter has been a sharp pullback. 

IWM Momentum Phase
NYSE Momentum Phase
QQQ Momentum Phase
SPY Momentum Phase


After spending a lengthy period of time elevated at extended levels, the % of stocks above their 20 period moving average dipped below 70.

% Stocks > 20 Period MA
 
On a higher time frame and also after an extended period of time at elevated levels, the % of stocks above their 40 period moving average has also declined, but not significantly enough to drop under the 70 zone.

T2108
These are the periods when a prudent speculator may want to consider transitioning from trader to risk manager.  The lock out rally has been forgiving, maximum adversity may not be so.

Sunday, February 10, 2019

New Highs v New Lows

New highs over new lows on a monthly time frame peaked in mid January.  New highs over longer term time horizons have not been expanding briskly to the upside. 

New Highs/New Lows

Current bias is over this week is a potential pullback unwinding extended breadth

T2108

Thursday, February 7, 2019

Potential Pullback

Stocks > 20 Period MA

Markets unwind slightly differently when breadth is highly extended to the upside than the downside.  The percentage of stocks above their 20 period average has been within a zone where pullbacks become increasingly likely going on four weeks now.  Today's action suggest the time has arrived for some form of digestion through price or time.


Market Breadth
With a number of other breadth indicators within extended zones, market risk has increased.  These are periods where what took the month of January to bank can take a few days to donate. 

Sunday, December 23, 2018

Friday, December 14, 2018

20 Years of T2107 and T2108

Today I decide to take notes of the monthly data for the percentage of NYSE stocks above their 40 and 200 period moving averages.  

T2108 1998-2008

Using below 20 as the threshold, between 1998 and 2008 what stands out on a monthly perspective is the threshold for the percentage of stocks above their 40 period average was clipped three times.  Each of these occurred during a significant market move to the downside.  1998 occurred during the pivot low for that correction.  A bounce followed 2001 and established a pivot low but did not establish the market low for the entire correction.  2007 happened close to the all time high and was a prelude of things to come down the line.

T2108 2008-Present

Between 2008 to present there have been four dips below the 20 threshold.  The 2009 dip sealed the market low.  The 2010 flash crash period established another market low.  The correction of 2015-2016 had a significant lag time before the market bottomed and resumed an uptrend.  Recently there has been a dip below and it remains to be seen how this will play out.  However, another dip below is looking like a strong possibility.  

T2107 1998-Present

Since 1998, on a monthly perspective the percentage of stocks above their 200 period moving average has dipped below the 20 threshold six times.  Three times this occurred during the bottom, and three times this occurred during the bottom process as price continued to drag and the markets continued lower.  

Using these past occurrences as model to asses future probability, I expect  there will be more downside in price.  I'm also expecting  this to last longer than historical average in duration.  Moving forward, I'll be placing slightly less influence on how stocks above their 40 snap back as they've been shown to move between extended to the downside to the upside earlier than the market bottom.  What I'll be more mindful of over the next few weeks is how deeply the number of stocks below their 200 moving period extend below the 20 threshold and how robust any snap back rallies are.  The snap backs with velocity from below 20 have more closely aligned to turning points.

Thursday, December 13, 2018

Further Deterioration

Market breadth continues to deteriorate.  If the recent past is any indication, a potential bounce may be on the horizon.
 
Market Breadth

Wednesday, April 5, 2017

Lower Highs with Lower Lows Affirmed

Over the past two weeks I've been paying attention to the IWM as this index was showing continued weakness, particularly in relation to the QQQ.  One of the pivot levels I was focused on was 138.  This area was the first lower high after making an ATH.  While nearly clipped earlier this week it has remained unbroken for 13 trading days.  Additionally of the three trading days this week, two have been range days with higher volume to the downside.

IWM 04/05

The SPY has also been unable to make fresh ATH and continues a pattern not dissimilar to the IWM.  While a recent lower high was clipped today, the fade by end of day brought it back below.

SPY

The QQQ continues to be the strongest of the three, making a fresh ATH today yet reversing to finish near the low of the range on high volume.

QQQ


Also of note is an increase of new lows to highs across three time frames.

New Highs New Lows

The next key pivot level I'll be paying attention to is the 03/27 lows.

Sunday, February 26, 2017

Weekend Review 02/26/2017

One of my personal objectives this year is keeping money.  This seems like a patently obvious notion --and it is-- yet this has been a notable blind spot in my track record which I'm looking to rectify.  In practice this means being more disciplined and selective of the periods I will trade and how heavily I will expose capital.  In order to better quantify these periods I've begun to increase emphasis upon my % Win/Loss and Avg. Winner v. Avg. Loser to determine when my risk of ruin is drifting upwards as well as a risk/reward quadrant that aligns my trading philosophy more closely with my trading objectives.

One thing I've noted as the month of February comes to a close is that my Avg. Winner/Avg. Loser ratio has begun to decrease.  This is coinciding with the overall market reaching a zone that I consider to be extended.  A metric I pay close attention to is the percentage of stocks greater than 70 over multiple time frames, the 20, 40, and 200 day period.  As the number on all three time periods has clipped 70 over the past month of trading my near term expectation is an upcoming pullback across the shorter period with the possibility of carrying over into the higher time periods.  There is already evidence of this occurring over the 40 day period.

% Stocks > 20 Period Moving Average

% Stocks > 40 Period Moving Average
% Stocks > 200 Period Moving Average


Additionally the breadth trends I follow have been waning for some weeks now so the overall market is entering a phase that I consider to be higher risk with lower reward on my time horizon.  At these levels I'm becoming increasingly skeptical and focusing more on capital retention then appreciation.  I'll lean more towards reducing position size and expectation along with avoiding margin.   Continued erosion of these numbers would result in a breadth flip that would increase my cautiousness and begin to look at exposing capital on the short side.

Ratio of Stocks > 25%+ in a Quarter

Stocks > 13% over 6 Weeks