 |
| Transition Phase |
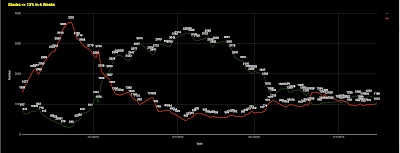
What this highlights is that within the past 6 months there has been a higher correlation between stocks moving in one direction and just as quickly moving in the other. Prior to that there were 18 months of a fairly static range where these numbers oscillated but didn't fluctuate much. From a lower correlation market of stocks there was a transition phase into a high correlation stock market which is now beginning to compress again.
This compression is highlighted on a lower time frame of 6 weeks.
 |
| Compression |
Market moves over a 6 week time frame have been compressing and this is evident chart wise on a number of stocks that have been mostly flattening over this time period.
The number of new highs and new lows over this period has also shown compression near a zero base with ticks above and below on the longer term time frames. There has been some fluctuation on the shorter periods but no significant directional burst. Each time there looked to be it pulled back in.
 |
| New Highs/New Lows |
No comments:
Post a Comment