Saturday, February 11, 2012

Weekend Review 02/10/12

NASDAQ 02/10/12
On the surface everything looks calm and the persistence of this swing that started in December is clearly visible with the up days out numbering down by 2-1.  Under the surface however, one of the breadth indicators I pay keen attention to is showing the move stalling here.

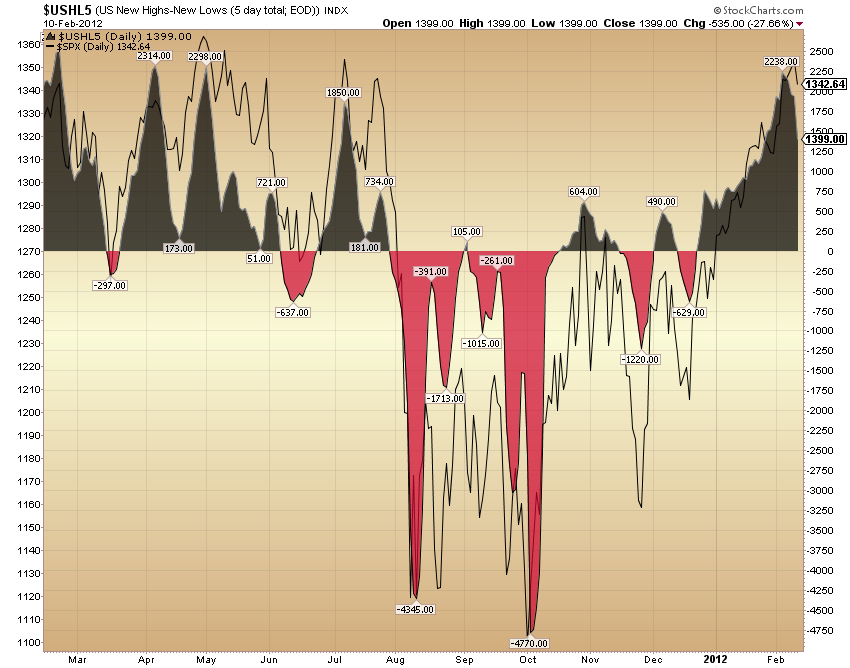
$USHL5 02/10/12
On 02/03/12 the $USHL5 peaked at 2238 and finished this week at 1399.  If we measure the move of the NASDAQ over this time the change is .06% which is in keeping with a market of stocks that are no longer making new highs.

Corrections don't always have to pull back x%; sometimes they can occur through sector rotation which will not be obvious when looking at the indexes but is clearer through the action of individual stocks, and sometimes the move unwinds sideways which may be witnessing here.

Individual stock action is showing the break outs are working in this market and 52-Week Highs are in play again.  In addition stocks are breaking out from solid set ups and new set ups are continuing to emerge on a daily basis.

Ideally I'd like to see some pause for a few more days so bases can continue to form, but every time I've been on the alert for some pullback it has failed to materialize.  I won't be holding my breath for it to occur this week either.  My focus  this week is on buying break outs and selling when they become extended with the belief that this is the safer means to navigate these waters.  Should a pullback commence extended stocks are the most vulnerable to getting tagged first so selling strength involves less risk under these conditions.  

Sunday, January 29, 2012

Weekend Review 01/27/12

 It is documented that some of the largest and swiftest swings from lows occur during bear markets, so the initial move on the NASDAQ of 17% from the October 3rd low was greeted with justifiable skepticism. Historical evidence could lead one to conclude that this may be a “bear trap” and the following decline of nearly 11% would have reinforced this belief. The continued volatility during this stretch would have furthered skepticism as well.

 The subsequent moves when looked at more closely yielded clues giving increased validity to an established bottom being in place. The beginning of the move occurred after undercutting the August low with downside breadth exhausting itself. The ensuing pull back of 8% was followed by a 5% gain and the subsequent pull back of 5% put in a key higher low inflection point. In addition, the width of the daily range began to tighten up as well with volatility decreasing as indicated by the lack on 1%+ daily swings.

 Once the new uptrend established itself and more participants began to believe in the underlying rally the louder the chorus of “pull back” could be heard. It's only human after all that people who missed the train would yearn for it to wreck. I thought two weeks back that a pull back was on the horizon and acted in accordance with this belief by taking much smaller positions, so while I managed to participate in most of this rally I clearly wasn't taking the ICE.

 Recently "Market Wizard" Mark Minervini  published a blog post about "lockout rallies"  A key point that he emphasizes is:
Many inexperienced investors will be looking to buy a pullback, which rarely materializes during the initial leg of a new powerful bull market and from the onset may appear to be overbought. 
Even though I've read this and understand the implications of what is being said, I approach this upcoming week not giddy, but even more cautious. The rally has just had a 10% up leg without pause and clearly broke through what I believed to be a key inflection point, the October 27 high. The length of the entire move has pushed the Russell, Wilshire, and NASDAQ up 20%, an accepted metric of when bull markets begin. 

%Move From Bottom and Proximity to 52-Week High

 I think it foolish to argue against the legitimacy of this move, and perhaps I should throw out caution and push my positions, but I'm going to side with my current understanding of the underlying market structure from a breadth perspective and maintain a state of gingerly tip-toeing through positions with reduced capital risk and focusing on shorter term holding periods and stocks that are not extended.

Key Points I am looking at this week:

1)  There has been a lack of volume during this most recent leg as indicated by the entire month of January being on below average volume as shown on the SP. Technically this is considered weak action and while this may be true, it does not necessarily follow that this rally itself should be looked upon suspiciously as there has been a steady stream of continuous buying coming into the market.

This lack of volume may simply be due to a lack of interest and/or belief.  There may be plenty of money lined up on the sidelines in anticipation of a pull back before entering and there may still be a large number of people who just don't believe yet.  Unless there is large volume selling hitting the tape, it is my contention that volume will pick up with increased participation.

SP Week of 01/27/12
 2) The $BPNYA has moved above 70. This indicates that 70% of stocks based upon Point and Figure charting are in a confirmed uptrend. When this moves above 70 it suggest an over bought environment where the potential of a pull back increases in probability.  
$BPNYA > 70
3) A secondary signal I follow on the Market Monitor shows frothiness in the market.  I've noted in the past that  it has proven most useful to me to be cautious when it signals.  

This market may very well  rip higher and continue the "lockout" effect.  As a result I may miss out on the potential.  However, the fact remains that there will be a pull back at some point and I'd rather keep light on my feet and miss a few opportunities here and there and bide my time for a sweeter spot.

Monday, January 16, 2012

Weekend Review 01/13/12

Market breadth analysis is not an exact science and won't always be neat and clean like a surgeon's incision; sometimes the analysis from the evidence is more like a hack from Jason or Freddy –a little messy. What may look cautious one week may look over exuberant the next. Market state is in constant flux, undulating like a raft along a meandering river, sometimes smooth and other times jostling from category IV.

I view analyzing market breadth not in terms of market prediction, but market prognostication. The weekly exercise isn't about determining whether the market will go up or down; rather it is part of my tool box to assess what I perceive of as favorable market conditions and how I can incorporate this into a weekly plan. It is a measure of risk first as to whether I believe I should be in the market at all and once this is addressed, what is my level of risk tolerance coming into the week.

Coming into this week I noted divergence occurring. Divergence in itself is not enough to prevent trading signals to be taken, but it did have significant influence upon my risk tolerance and number of positions I felt comfortable managing, the holding period I would feel comfortable with, and how quickly I would move my stop to break even and my willingness to accept scratch traders much more quickly.

So, while last week I was cautious due to what I perceived as divergence, this week I am cautious as to signs I see of exuberance. Currently the AAII sentiment survey closed at nearly 50% bullish, the highest rating since February 2011. Readings above 50 are uncommon, so when the herd becomes giddy my first instinct is to become cautious. In conjunction, the major indexes are approaching or touching a key inflection point, the October 27 pivot. My belief is that this is a zone that is going to be keenly watched by market participants for resistance/support.

A market maxim states: “Markets don't go up or down, they go up and down.” Over the last month there has been a persistent bid to this market with very little indication of selling pressure. This is mirrored in the indexes as well as they've had a consistent upward trajectory with a daily dip or two. It would not be unexpected to see some for of dip this week. However, overall the market continues to look healthier and with earnings really kicking in gear this week the action over the next four days should be less news driven and return to stocks themselves.

From a top down perspective, what I'm noting this week is the continued move of the Russell above the 30-Week MA.
Russell 2000 Week of 01/13/12
The $BPNYA is still in bullish confirmed since December 07 and is still below the 70% threshold.
$BPNYA 01/13/12
The $USHL5 has steadily increased as well.
$USHL5 01/13/12

Wednesday, January 11, 2012

Where the Sun Don't Shine

It's late night at the diner and the pickings are slim and the dregs at the bottom of the pot are burnt. Action like today gives pause as it exhibits a “something to do just because” mentality with a select few stocks as the soup du jour. Bottom fishing yet again took the lead today as my scans show 213 stocks up 4% today on greater volume but with just 19 within 15% of their 52-Week high and half priced under $5.

Today's theme was solar, a group quite beaten down and hovering near 52-Week lows with no significant catalyst having moves of 30%+ nearly across the board. It probably didn't hurt that solar as a whole was a powder keg to begin with and ready for igniting given the float that was short coming into today: FSLR 35%, TSL 24%, JKS 24%, CISQ 14%, SOL 8%, and JASO 7%.

Today's market action can be summed up thus: “Well, what did you do that for?” --”Because I can.” When this type of herding into a select few stocks begins to occur and the fluff rises to the top, it's suggestive of a market that's reached a boiling point and may roil over. In general these will not be the type of stocks that will garner institution support and will instead have their short term momentum phase revert. This action suggest the market may be running on fumes here and a pause is on the horizon. A small pull back here should be welcomed as an opportunity for stocks to set up.

Tuesday, January 10, 2012

What's Swinging?

It's quite apparent there are pockets of strength in this market as evident by recent all time highs. They reads like an ironic tale of eating at McDonald's, then haven a Sam Adams and Phillip Morris smoke, then using an Apple device with Nike+ to redeem oneself the next day. There are also pockets of extreme weakness as well with a number of former leaders in severe decline. There have been few opportunities over the past few months to swing trade for any length of time as each day that passes is like being stuck in a crappy corner in minesweeper.

Currently volatility in the market has begun to wane and over all market breadth is much improved, however set ups continue to be few and far between at these times vehicle selection is critical. Since the October bottom, my preferred selection of stocks near 52-Week highs breaking out have not been working, but stocks near their lows are. Additionally low priced stocks in terminal declines have also shown to be performing well during this period.

In order to get a composite of what is currently working in the market I've used TeleChart to break down my universe into four time periods, Price Percent Change 5-Day, Price Percent Change 1-Month, Price Percent Change since 10/03/11 and Price Percent Change 26-Weeks. In conjunction I choose a heading list indicating the Symbol, Volume(Dollars)1-Day, Price Per Share, Sort Value, Price as Percent of 52 Week High, and Sub-Industry Group.

From this list I can then hone in on and separate according to my criteria which stocks are working and where strength is being shown.

5 Day Change
1 Month Change
Change Since 10/03/11
Change Over 26-Weeks

Monday, January 9, 2012

Sector Rotation From 10/03/11

Glancing at sector rotation since the October rally shows  Energy, Industrial,  Materials, Financials, and Consumer Discretionary outperforming the SP.  Tech is lagging.

Ranked by % Change 10/03/11