Sunday, February 23, 2014

Weekend Review 02/21/2014

One of the characteristics for much of 2013 was the tendency of the general market indexes to be in lock step with each other.  There was a high propensity for V-Shaped bounces to make a marginal new high that was followed by a dip or digestion.  While there wasn’t perfect harmony, and outside of short windows where one would outperform, there was unison in that if one made new highs the others would follow shortly thereafter.  Since the January pullback and bounce the COMPQ has been the first to make a new marginal high, the SPX is within a whisker, and the $NYA, $RUT, and $INDU are still trying with the later two struggling slightly.  This may simply be a period of outperforming by two while the others play catch up, but if there isn’t unison in new highs, a change of market character should be noted.

COMPQ
$NYA
$RUT
$SPX

$INDU


Based upon what has been the norm since 2013 I’ve jotted down a few things to pay attention to in the near future.  1) Will the lagging indexes catch up and make new highs or will the leading draw down?  2) The SPX is in a zone where it churned from December through January.  It is a concern if this does not break and run through convincingly.  3) December and January are seasonally strong for small caps and they are now beginning to lag.  4) There are breadth divergences occurring.  Will they matter this time?

The breadth divergences that I have jotted down are the following:  The number of stocks in the NYSE above their 20 period moving average is in a zone where pullbacks or digestion zones occur.

$MMTW

The T2108 has been showing divergence with fewer stocks participating with each bounce:

T2108

The number of 100 day highs on the SPX has been diverging as well showing a divergence as fewer stocks participate.

SP % 100 Day Highs

This is also shown on the NYSE where the percentage of stocks at 52-Week highs has been steadily declining.

NYSE % at 52-WK Highs

I believe that we are currently in a stock pickers market, especially due to decreasing participation from a narrowing basket of choices. One of the focal points of my chart review session this week was newer issues that are setting up on the weekly time frame near their 10-WK MA or their all time high, as well as those that have gone up 100% from their low.  As the meat of earnings season is winding down and catalyst will be fewer, I suspect there will be some good risk/reward trades from many of these newer issues.

BFNT
SBGL
ADHD
CTRO
LEAF
STAY

Sunday, February 16, 2014

Weekend Review, February 14, 2014

Across the board the major indexes have undergone another V-shaped recovery with the COMPQ and SPX testing new highs while the RUT lags.  Whether this matters remains to be seen, but for the time being there's at least one chart with a head and shoulders pattern for one to hang their hat on.

$COMPQ
$RUT
$SPX

Going into this holiday shortened week I'm optimistic given the number of charts from my watch list setting up continuation patterns.  I return to bar charts from candlesticks yet again as I reevaluate my charts from the perspective of developing one's chart eyes (Kacher/Morales).  I tend to find that the patterns are simpler for me to perceive and I'm able to more quickly and efficiently identify the set ups I'm willing to trade.  This weeks bakers dozen:

AEIS
AER
APOL
ARAY
DHT
DXM
HZNP
SIMO
SMCI
TK
UCTT
VMC
CSII

On my time frame the market I trade looks healthy with a bountiful of opportunities to take advantage of.  Given the V-Shaped recovery it's important to avoid stocks that mimic the markets pattern and look for those that have consolidated in a sideways fashion.  One of the keys for me over the next week or two is the behavior of the indexes when they clip new highs as there has been a strong tendency for this to mark the end of the meat of the move before there is a pullback.  During these periods I've noted that the tactics used have more importance than the overall strategy and that while the later should not wag the dog, the prior are more subjective to the markets whims.  For myself that means more aggressive in profit taking and less forgiving of stocks that lack follow through within a few days of entry.

Thursday, February 6, 2014

Our Trading Data Lies to Us

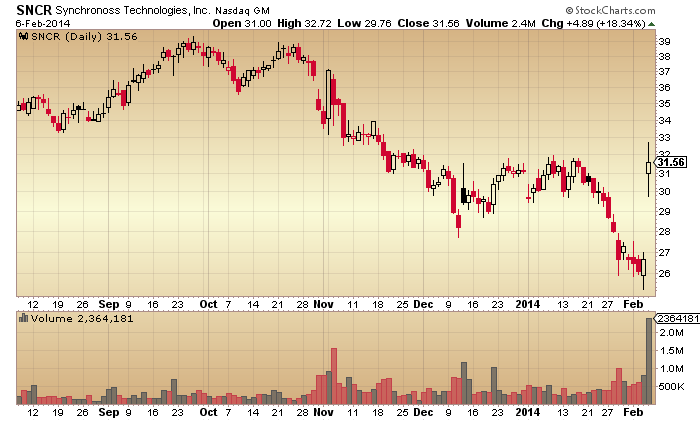
We are only as good as our data source and our data source is often inconsistent if not outright misleading.  I’m not 100% sure if realizing this earlier would have improved my trading but I understand it now much more vividly and it has altered my approach, especially in stock scanning.  One would think that the most simple of data points, a stocks float, would be constant across multiple providers, but it’s not.  Ex: SNCR- 18.2M from TeleChart, 34.4M from FinViz, and 21.15M from Yahoo.

What about volume?  Well, TeleChart’s volume is provided through BATS and often TC rounds, so 2.4M today, 2,363,466 from FinViz, and  2,364,181 from Yahoo.  And keep in mind this is just the known volume on the session and does not include dark pools so we can assume it’s probably much higher than any of these numbers. And Price?  Our charts deceive us here as not every price tick gets recorded and this results in the fact that the days high and low may not be accurate not only because of dark pools, but sub-100 lots will not register a tick on the end of day chart.

What about earnings? Today FLDM had earnings and ThinkorSwim has an estimate of -0.18 with an actual of -0.15. Briefing has and estimate of -0.13 and an actual of -0.04. Now I understand how analyst estimates can be site dependent, but the actual result should have no wiggle room what so ever.

Trading is a game of incomplete information and so is our trading data.  This can effect our entire trading plan from our vehicle selection and which stocks enter our universe and which do not based upon our scans as well as the criteria we use to build them.  This can effect our entry signals based upon which source has the most current and up to date information let alone the most accurate.  This can effect what type of alerts we use and what combination of criteria they are based upon.  This can effect how much we choose to micro-manage our trading.


What I’ve taken from this realization most is acceptance that there is an inexactness to trading and to release the tension of perfection in making sure I have the best candidates to trade. I no longer worry that I have the most precise entry requirements.  When price runs through an alert but it never triggers and I lose profit as a result of not exiting at my target or my stop runs slightly and my loss is larger, I’m much more at ease in letting it go.  In other words I’m learning remove precision, allow for sloppiness, and be OK with keeping it simpler.

Model Book February 06, 2014

Some recent additions to my watch list for the next three to six month time frame.
YELP
SNCR
PTEN
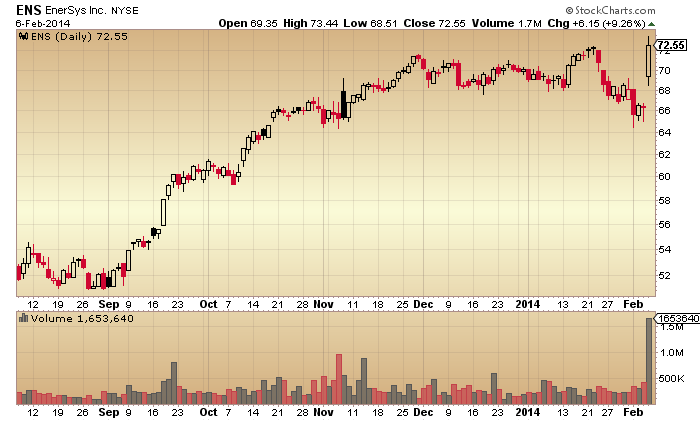
ENS

Saturday, February 1, 2014

Model Book January 31, 2014


On occasion even one of your favorite, long defunct bands, can surprise you with a gem you've never heard before. It got me thinking there must be a trading lesson in there somewhere, and maybe it's in my Pick-6 I pulled from one of my scans.

ARAY
MOD
MTW
SZYM
WYNN
ZYNGA

Wednesday, January 29, 2014

Earnings Model Book January 29, 2014

Process in it's most basic form is continuing to do what you do as the market does what it does.  Three stocks popped up on my scans today and have been added to my watch list to monitor for the next three months.

EZPW
FSL
RFMD

Sunday, January 26, 2014

Weekend Review 01/24/2104

The week ended with selling hitting the tape as 517 stocks in my universe were down 4%+ for the day.  The last such occurrence of this magnitude happened on 06/20 of last year.  Whether or not the ensuing action is similar remains to be seen, but caution is clearly warranted yet again.  The mere utterance of suggesting caution here reminds me of every day in 2013 that had a sell off on the major indexes above 2% only to see them rebound quickly and blur the fine line between risk awareness and risk aversion.

Over the past few years as I’ve honed my craft I’ve spent a considerable amount of time pondering and writing about market breadth and timing.  At times I’m unsure whether what I’ve written was from earnest or ignorance, and perhaps there isn’t much distinction between the two when it comes to trading, but warts and all I’ve externalized my process and have bread crumbs to follow.  What’s noteworthy is that in 2013 I was completely off base as the general market lacked cyclical behavior and often I would chastise my own analysis for not being more attuned to this, but in the least I’m in good company as the year 2013 befuddled many.

In hindsight 2013 appears to be an anomaly.  The slow and persistent grind up with corrections lasting mere days, yet just enough to get the claws extracted before the horns thrust upward befuddled and dumbfounded many.  I was fooled often and somewhat perplexed as many of the signals I use in my risk management tool box turned out to be nails and the market was the hammer.  What I had begun to practice the preceding years and learned to trust tested my belief, however, isn’t this exactly what the market does?

Two weeks back, Frank Zorilla posted the following on his blog: 2013 Conditioned Me To, and this got me thinking again about the concept of maximum adversity as described by Penfeld and viewable here: Maximum Adversity.   In circumspect, 2013 looks just like a market that is setting up the most participants for the most hurt as it has likely conditioned the most for it. 

In keeping with this spirit, one of the things I’ve been reflecting most upon is what did the market of 2013, or perhaps more precise late 2012 to current condition me.  Perhaps most disconcerting is that it did indeed cause me to lose faith in signals, especially this suggesting breadth was extended and the market in need of a pause.  In addition, when these signals arose I threw caution to the wind and failed to make proper adjustment to positions sizes and targets in a market that was extended.  In fact I thought that if anything the overheated nature
 would continue which brought misjudgment.

An example here is the signal I had for trading the VIX which began to show up a few weeks back, about the same time that my positions were beginning to show a lack of follow through, gap downs that lost profits, and stops getting tagged consistently. Of course this could just be recency bias and it remains to be seen if the the cycle required to profit from this signal consistently has returned to the market or not, but the simple fact is that signals are to be taken regardless of outcome if they have shown to have an edge over time.

2013 conditioned me not to follow bearish signals

To a strong degree risk awareness comes down to situational awareness and refining the nuances that each market period expresses and being able to adapt swiftly and bend like a branch, bow like the trunk, but never break.  In experiencing multiple market cycles and knowing that there will be periods that test one’s resolution and show one to be incorrect repeatedly, yet not being swayed in the moment.  realizing that over time there will be cycles and periods of pain.

Going into next week I have a couple of thoughts about what my plan of action will entail.  From a long perspective I see little point to expose myself under the current market conditions.  I’ve said this before and I’ll say it again with the acknowledgement that come Wednesday everything I believe today may be wrong.  Additionally I’ve recently expressed my views in a few tweets about my current perspective on China:


With the Chinese new years upcoming and their market being closed for and extended period I suspect all types of shenanigans to occur in these stocks, especially the potential of a hit piece from select short sellers.  This is my hypothesis until proven incorrect.  I am also focused upon biotech and shorting IBB by selling premium as I view this to be overextended and will be looking to trade around what I expect to be a down draft.  Other than this, I will continue to monitor earnings and curating a watch list of stocks that have the best reaction.