Saturday, June 30, 2012

Weekend Review 06/29/12

Stock trading and politicians share similarities, primarily the ability to flip flop to make a buck; however, traders are different in that they must also admit when they are wrong or held the wrong belief because the penalty can be swift and harsh. In part a reason why traders must be so quick to change their mind is that each moment in the market is unique, yet paradoxically ubiquitous, so at times it feels a lot like dancing barefoot on a pin head which takes a sense of balance coupled with the ability to withstand a little pain. It's difficult to alter opinion with frequency because it's an inefficient use of grey matter and results in a constant sense of disharmony and discomfort. 

When perusing through some previous post prior to beginning this one I noted how all over the map I was. My general outlook was very pessimistic a couple of weeks back and recently I was resigned to another Summer of a choppy, volatile range. At the same time I was periodically optimistic that perhaps there is something going on underneath the surface that my negative mood was biased against observing. Perhaps a bit bi-polar, but that's what the markets do to me at times. As I've come to have greater acceptance of my abilities and more realistic understanding of my capabilities I've acquiesced to the reality that I just don't have the knack right now to trade the market daily and must be more selective when I do and learn to be much more patient and wait for those moments. I've been trading long enough now to know they will come around, I simply have to assuage the frustration through discipline.

One of the nice things about being all over the map however, is being able to see a lot of different vistas. One of the lessons that's been drilled in over the past two weeks is that although I was constantly monitoring the market and noting observations I was a little too negative in my mind set to maintain my daily process and ritual and being fully prepared for whatever happened the next day. I became a little too blase and lackadaisical in my approach and got a little sloppy in my habits, so what I'll work on carrying forward from this day is sticking to the program period.

For the past two weeks I've been working off of one chart template which I've designed to give me insight into the market behavior based upon historic volatility, the separation of the 15 MA from the 30MA, and the number of 1% and 2% days in the market. One of the reasons I'm keying in on this more precisely is due to it more closely aligning with my studies and observations of price expansion/contraction cycles as well as velocity of price moves offering me a simpler view from which to approach charting. It's cleaner and more to the point of my aims.

From this perspective my observations are that today's move shares similarities to the 12/20/11 bar that commenced the linear up trend through mid-March. The 15-30 had a cross above 0 a few sessions before this move began, not unlike now. Onward I'll pay attention to HV and note if it declines as well as if the number of 1% and 2% days diminish from this point forward. In a smooth, linear uptrend HV should decline and wide range days decrease in frequency.

SPX 06/29/12
  A very positive sign is the Russell which outperformed the other indexes this week. I've noted before it is my contention that the Russell must lead and today it clearly took charge with a 2.91% gain. Another noteworthy sign is that the NASDAQ-100 lagged considerably. Of the indexes I watch, having these two be the bookends indicates to me that we're entering a market where risk is being taken on and that money is flowing away from many of the old guard leaders and I anticipate that this will be a more robust and broader rally with money flowing out of the same: CMG, PCLN, APPL etc... and flows into small cap.

%Change 
Looking at the underlying breadth, the secondary has had a near straight moon shoot over the past couple of days and placing this indicator firmly on the bullish side with a decisive break from an oscillating period. Another positive is that the primary if still bearish, albeit slightly, indicating that there is a lot of powder left in the keg for a sustainable rally.

Secondary
Primary
Everything I look for to determine my trading periods and level of aggressiveness has aligned so going into next week it's simply a matter of stalking and taking shots when my triggers alert. I'm expecting volume to decline due to the holiday shortened week so any trades I take I don't plan on staying with for too long, particularly since Friday's gap busted a number of short term patterns that I follow, so a few days rest would allow many to reset.

Friday, June 29, 2012

Well Everybody Knows

There will always be people with better and more accurate information, and have the ability to process it quicker and act upon it faster than I can. There will also be people who get this information from the inside and sometimes from the bearded mouth himself. We know from documentation that the FED would talk their book to Goldman Sachs which allowed GS to in turn position themselves accordingly. We also know the back pockets of politicians hold a lot of greasy dollars and their not immune to passing off policy information before votes are cast.

We know that there are typically two times when a stock gets downgraded, after it has dropped from $100 to $8 is usually a good time, and the other time is when a stock is clipping new highs; not that the stock is too expensive mind you, it's just that someone else wants it cheaper. This is how the game is played so there's no use crying about it. However, that doesn't mean there isn't something we can do about it and yesterday was a good example of what to pay attention to.

Going into yesterday the major indexes had strong moves of over 1% with many closing near their highs. It looked at the time like constructive action as price action was firming and the higher low was being confirmed. Then the gap down hit the open and the markets began to hemorrhage clipping that higher low and at one point being down as much as 1.5%. Clearly this looked ominous and suggested to me at the time the June 04 pivot low would be in play over the near term. But a funny thing happened.

Buy Buy Buy
Going into the close the buy button was hit and the indexes back tracked and the Russell actually closed higher for the day and near the previous day's close. Now I can't know for sure if someone in the EU was talking their book or not, but if I was Merkel I might want to put on a little hedge position and make sure some were positioned to take advantage of the situation in a manner that was beneficial for Germany (especially after that poor performance!). Knowing this or not is not important to me, but what is important and a valuable lesson from yesterday is improving my awareness of these little nuances when the indexes flip intraday from blood on the streets to just a flesh wound.  It might take me a day later to get the picture, especially when I was too busy watching the German back field get shredded like Parm, but I'm a bit slow at times at times anyways.  

Wednesday, June 27, 2012

Anticipation

If there is an environment cleverly schemed to take advantage of people's behavior it's casinos. Walk into any casino and immediately you're hit by flashing lights and the sounds of bells and clinking coins. Once the door closes the tinted windows make it difficult to distinguish night from day in an attempt to make time cease to exists. Even if you looked you'd be hard pressed to find a clock anyways but don't worry about getting too tired because the pumped in oxygen will keep you alert.

If you care for a game of skill where your knowledge will give you an edge you'll have to walk the gauntlet of the games of chance and maybe you'll get lost and decide to throw down a few bucks on the wheel and have a cocktail because the room you;re looking for is usually hidden in a corner away from it all or in a separate part of the casino down some hallway. And when you've finally called it a day you may just toss down a lucky buck at the slots on the way you. It's all cleverly thought out to milk the cash from the cow.

The most cleverly designed machine of cash extraction is the slot machine. For every dollar the expected return is a few tenths of a percentage less but that doesn't seem to keep the herd from sitting down and using three at a time. Slots are specially designed to exploit what I discussed about in a previous post, anticipation and the false expectation of a series after two data points. When the first 7 hits the anticipation builds and when a second the pleasure response begins to fire even more in expectation of that third seven. What's more nefarious about these machines for those that play them is that this anticipation occurs long before before pulling the lever, it begins entering the door and that's in part why they are at the entrance.

I don't play slots but I did mention being influenced by a few traders I follow on twitter who were taking positions a week back. At the time I was trying to deduce what they were seeing and these two behaviorism were what I choose to explain it to myself. The reason I bring this up again is because they were at it again today as one began making inference that he was taking positions and the other was talking about taking light positions here. So today I wanted to return again and chart their mentions.

Tracking Twitter Trend
We live in unprecedented times where even if you lived on the tundra as long as you have a net connection you can get access to world class traders who will engage with you and are willing to take time to teach you through webinars. I don't expect myself to be aware of all the nuances they see or understand, however that doesn't mean I shouldn't take the time to process what they say. In order to make it understandable to myself I chose to use what I've learned through modern neuroscience and casinos so that it becomes meaningful and sticks, but next time I might use a Grimm's Fairytale, a fractured fairytale, or those loveable magpies Heckle and Jeckle. The point being, be aware of what they say and take notes and internalize it because as traders we're lucky to have it.

Now, on to breadth. Today was a key day as indicated by the Russell which outperformed today and showed great strength closing near the highs of the day. I'm still of the belief that if there is going to be a sustainable rally small caps need to take part otherwise money just keeps flowing like water into the stale bread leaders. New leadership comes from small caps so today was very positive.

Russell
In addition today the secondary indicator I use crossed over again.

Secondary
Lastly, the 10 day differential of buying to selling has been improving. Granted the underlying buying pressure has been modest, but the heavier distribution that the market has seen over the past few months has been waning as well. This become clearer when looking at the raw numbers.

10 Day Differential
Raw Numbers
The main focus now is honing in on stocks that are showing relative strength because if the market will begin a new leg up the correction over the past few months should start showing up on the charts and quality set ups should stick out like a sore thumb.   

Tuesday, June 26, 2012

Where the Wild Moves Are

Top 50 stocks from the June 04 low.

Top 50
Top 50 Russell
Top 50 Russell

Sunday, June 24, 2012

Weekend Review 06/22/12

Coming into this past Monday I was heavily influenced by three traders I follow on twitter who went long the previous Friday. I was curious what they saw that I was missing and it wasn't immediately apparent so I put it on the back burner to stew –occasionally stirring. If it wasn't for their influence upon me I would have started the week off in a much more bearish mindset, but their decision to expose themselves long in addition to their stature got me thinking I might be missing something bigger and is in part why I opted to expose myself long early in the week.

Nothing clicked through most of the week and I was uber-curious about the psychological shift in direction of these traders who I've come to have a healthy respect for. What cues where they picking up from the market that I wasn't attuned with? In the process of writing up this weekend's market analysis I reviewed some previous notes in which I was chalking and charting a key pivot for a while, but really didn't place this into a proper context and didn't connect the dots to a suitable reference to place it within.

While I'll get to the subtext in a moment, first a little digression. Technical patterns dictate that a new uptrend commences when there is a series of higher highs and higher lows. A rally off of a correction in turn would commence with establishing a pivot low and thereafter a series of lower highs and higher lows. In this context last Friday's price broke a key pivot inflection point which would in turn alert one to the the potential of a new up trend since this indicates the first stage of one.

Given that there's been a 10% correction thus far which in historical context is not unusual by any means but is significant in so far as a drop further becomes statistically rarer and hence less probable, one should also become more bullishly biased; further after a drop of this magnitude the immediate response should be to begin looking for behavior and characteristics of a new rally break to trade and again the first indication one is occurring is establishing a new lower high.

Also, catching the market after a rally break off of a bottom offers the best risk/reward ratio. If the timing is correct then there is only profit extraction to focus upon and if this turns out to be a false bottom risk management and positions size helps neutralize the down side risk.

What finally began to click is when I contextualized a few pieces of information and placed them into a narrative that I understood and could expound upon, however far fetched it might be. Behaviorally the human mind begins to note patterns after a sequence of 2 data points and this is evident in standard technical analysis which looks for confirmation of an uptrend once a second higher low and lower (or higher) high is established. This alone did not fully explain to me why they would begin to trade this week since it was only one, but there's another behavioral pattern that assisted.

Once the new lower high was established the effect of anticipation of anticipation took hold. Behaviorally we will not only anticipate an event or outcome, the anticipation can have such a strong influence upon us that we'll actually anticipate this anticipation. So even though the new uptrend has not been established by technical means, which is simply a two step sequence from which we'll begin to expect a third continuation of, this expectation may occur much earlier in the cycle, after the first one is established.

I have little idea if this is exactly what transpired or not, but I do know that I was influenced and that is in part why I also made it a point last week to stick on point and filter the news driven catalyst through a narrow focus of historical volatility, market breadth and charts.

So, now that my thought exercise for the week is resolved, it's abundantly clear that the market is undergoing a fit of volatility like the terrible twos. There's a number of means of defining just exactly what is volatility so for this weeks chart I wanted to use 4 criteria. The number of 1% moves close over close, the number of intraday 2% moves from the high to the low, historical volatility measures and the separation of the 15 period moving average from the 30. The following chart is broken down in three periods, the market bottom in October, the run up from January through April, and the ensuing topping pattern thereafter.

SP Daily

Trends that begin with rally breaks are not unlike motorcycles accelerating from a complete stop. Early stages of trends will be erratic but once velocity picks up they will begin to stabilize just as a motorcycle warbles slightly before reaching a sufficient velocity to be in a state of equilibrium and balance between rider and bike. However, if the speed off the line is too fast or acceleration beyond stability occurs then a state of instability occurs and a crash is sure to come. Additionally these psychics apply to deceleration as well when the rider puts their feet down to keep the bike upright just a decelerating trend with a persistent bid will remain in a state of balance but lacking support will topple over.


Further, at some point all trends end, and when viewed from this perspective what stands out is the velocity peak that occurred in late January. By mid April this spread turned negative which would have been an early warning that the trend was coming to an end and allow one to prepare accordingly. Coupling this perspective of a trend with historical volatility which began to cross over the .50 point in March gives a complete perspective of both volatility and velocity which can be used to compliment a trading plan.

The last indicator on the chart is the number of intraday 2% moves and close to close 1% moves. For sake of convenience I opted not to calculate days that met both of these requirements and instead simply listed the raw numbers. What is noteworthy from this perspective is that in a persistent uptrend there are not many of theses days, but when the market begins to chop they begin to occur with greater frequency and often in succession. This can be used to further clarify the market environment.

Taking all of this and completing the picture, we're currently in the initial stages of a rally attempt. Expectations would be confirmed if the recent pivot high is broken and in turn disproved if the low is broken and there is follow through to the downside. There's also been a positive cross of the 15/30 differential so a new uptrend as defined by this separation would be confirmed as long as it remained positive and the sustainability can be deduced from it's velocity with slow and steady being the preferred. Lastly, the number of moves of 1% or greater need to drop out of the picture for tradeable swings to set up with higher probability.

Markets move up, down, and a lot of the time sideways. Sometimes they are volatile and some times sedate. . Ultimately we trade our own market as we define it and see it and eventually I'd like to get to the point where the primary influence upon my trading decisions is only myself and avoid being swayed by any other opinion other then the once I've come to.

Thursday, June 21, 2012

Fledgling Rally Gets Wings Clipped

I made it a point this week to focus upon two metrics to filter out what was expected to be a news driven 5 days of trading. Two days back the ducks were aligning and I noted a window of opportunity open as the Russell closed strongly above a key pivot point. I also mentioned how I was maintaining a stance of caution until the primary breadth trend indicator I follow flipped bullish. Fast forward to today and the results of Fednesday are in and is there much more to say than the market hemorrhaged like an Ebola victim.

The window of opportunity has been slammed shut and any lack of nimbleness the past two days resulted in fingers pinned to the sill. Obviously volatility has kicked up, the indexes have closed below the lower high pivot of 05/29, and the secondary breadth trend I follow has flipped bearish again. I started off the week optimistic of a short term rally having some legs and looks like I'll be ending the week on the sidelines, which is fine.  Now that the window is closed it's time to wait patiently for a knock at the door.

Tuesday, June 19, 2012

T-Minus 10

With the exception of the European Cup I have little idea what is happening overseas and with the exception of Matt Cain's perfect game I have little clue domestically. I know there's the Beard speaking tomorrow and possibly the SCOTUS decision as well. If I was paying attention to this I'd probably be discouraged about now and ill prepared for taking action, but since I made a strict decision to use a couple of filters for the noise I feel well positioned to act as warranted.

While the countdown has begun, I'm not ready to declare all systems go just yet. Over the weekend I listed two criteria I was looking for this week: a cross over of the secondary trend I use and waning volatility. In addition yesterday I noted in a post that I was becoming suspicious of the lack of leadership coming from the Russell 2000 and postulated that if it did not begin to step up than this rally would be lacking in broader participation and money flow would be focused upon the same old leaders. Today, the first two criteria were met and in addition the Russell led the pack with a 1.8% gain, finally breaking through a key pivot lower high.

Secondary Cross
Historical Volatility Declining
Russel Pivot Break
Additionally the timing tool I follow is continuing to show green shoots.

Green Shoots
Over the past couple of days a number of quality break outs have occurred and had follow through which is a promising sign; of note have been EBAY and LL. There have also been a few that broke out yesterday but became a tad extended and pulled back like SXCI and CHSI. In general the market has looked healthier than it has in months but with a 6% move off the 06/04 bottom I wouldn't be surprised to see a pull back, especially after four straight up days.

From a swing trading perspective a window of opportunity is opening. Over the last two days I've been active but cautious taking some very small positions and very fast exits. I'm still leery about holding for more than a day until the primary indicator I follow flips and volatility continues to compress and a solid up trend emerges. Again, the windows is open so if you can snatch the apple pie while its cooling now may be the moment to do so.

Monday, June 18, 2012

One of These Things Is Not Like the Others


Small Caps are lagging again and it's beginning to have that familiar feeling.  If these stocks don't participate in this move then my expectation is that there will be crowds flocking yet again to Big Cap/Tech with the money flow being pumped into AAPL, CMG, PCLN etc...  If that's the case then the implication is that the rally will not be very broad so vehicle selection and time frame decision as well as buying break outs or pull backs will be critical to success or failure of trades.

Sunday, June 17, 2012

Weekend Review 06/15/12

Looking at the breadth readings this weekend two things stood out, the 10 day differential between buying and selling has been slowly trending upward and this weekend finished at its highest reading since this correction began and secondly and discordantly it has done so on limited buying. While this is a flag, I'm not sure which color to paint it just yet as the distribution that occurred over the previous two months was methodical without signs of panic so in kind perhaps there is no rush to buy just yet either.

10 Day Differential
4% Adv/Dec
A look at the intermediate trend still indicates a bearish oriented market, however there is a noticeable squeeze occurring as the differential drops to the lowest since 05/03. A cross could occur some time this week and as such I'll be paying particular attention to this as a filter as upcoming news hits the market.

Secondary
 A secondary tool I'll be looking closely at this week to filter the news flow is using historical volatility measure as a guide of market reaction. As the following chart shows volatility has been declining over the past few weeks. A declining HV in and of itself is not much of a tell as a comparison to last years price action showed; the market continued to chop for two months after the peak. What I did find noteworthy is the what happens to HV when the chop subsides and a smoother trend commences. There is what I construed as a volatility sweet spot where this indicator sticks and stays during the majority of the up trend.

SP Historical Volatility
With the market firming I've begun to construct long oriented watch list in case there is a tradeable rally. If there's a momentum thrust to the upside and my indicators flip I'll be looking to take some light sized probing positions to see if I can build up a few small victories and take it from there. If I'm in cadence with the market cycle it should show up in the P/L column quickly and if I'm not then I'll step aside until breadth improves and the secondary and primary indicators both follow and align to the upside.

Friday, June 15, 2012

Bad News Bears... Is it time for the rally caps?

2012 has been sounding a lot like 2008- everything was just fine and dandy at Lehman and Bear Stearns until it wasn't and everything has been just fine and dandy in Spain and Italy until... Of course Spain believes it's doing fine and dandy because they just received billions of Euros and advanced to the quarter finals which makes me wonder if Italy is going to seek financing sometime before Monday's match against Ireland to secure their bid as well.

Regardless of the parallels of this act of Theater of the Absurd one thing I've come to understand with greater clarity is it really doesn't matter what I think and pontificate about world affairs when it comes to my trading because it simply doesn't translate well at all. More and more I've begun to stick to my guns and adhere to the clues that I can read from the market data and trust more in my breadth models and how it fits into my trading plan than trying to figure out how mutual indebtedness swaps could convince anyone of their soundness.

There's a distinct schism between my interpretation of macro events on a socio-economic and political level and a market level resulting in my instilling my beliefs upon the market and not allowing the purer market data to change my opinion. How I interpret and how markets react to news is often disjointed and more often than not clouds my judgement and inhibits me from seeing the subtle clues and shifts in perception. Further, even if I do recognize them, there often follows dissonance between the information and how I will act upon it resulting in a lag time.

There were a couple of clues over the past few trading sessions that when stripped of the noise of world events and placed in context with content suggest that the beginning stages of a rally have started. The 2.4% move on 06/06 could easily have been dismissed as simply a strong bounce in a correction and the chop thereafter did little to dissuade this assessment, however in conjunction with today's 1.29% move and very strong close at the highs,  evidence for a more bullish market orientation is mounting.

NASDAQ 06/15/12
Looking at the SPX using GMMA, the short term averages have begun a rally and are very close to having a complete cross over and the longer term averages have all up ticked sans the 60.  This bounce has legs unlike the previous bounce which saw these shorter term moving averages quickly realign to the downside.

SP GMMA
The indexes have held their pivot low for 9 sessions now and some have currently eclipsed their 05/30 pivot establishing a new lower high. If there is going to be a new uptrend these are the steps that must be taken.  The upcoming week will has some significant macro events occurring besides the Greeks playing the Russians at the Euro Cup, so how we'll just have to wait and see how this cycle effects the fledgling rally.  Thus far bad news has dented the market 10%, a significant correction but not extraordinary, and if the upcoming news is pessimistic yet the market barely bends be prepared for a strong rally.

Tuesday, June 12, 2012

Perspective

Sometimes changing the view leads to new perspective.  Same chart, different horizons.


Monday, June 11, 2012

Bottoming Process

One thing a study of the historical market bottoms in conjunction with chart patterns can assist in is awareness of what bottoms look like and act like. With this in mind, I collected a few charts from StockCharts.com which show a some of the more common bottoming formations.


Using these as a template we can put into perspective where the market currently is in relation to typical formations which can assist in clarifying where the market is. Does the following resemble any of these patterns thus far?

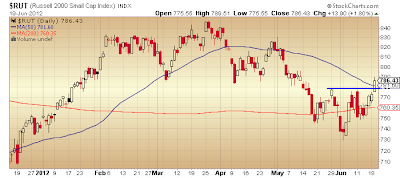
RUSSEL 2000
Taking the Russell 2000 and sorting by stocks that have underperformed the market during this correction and sorting those by dollar volume we can determine whether or not these patterns are forming in the underlying stocks and from this infer whether or not the indexes may follow.  If there is continued selling in these broken down stocks then it follows that it will be difficult for the indexes to put in that pivot low that distinguishes the bottom from the entire process. 


Friday, June 8, 2012

Hack Your Trading

A Green Shoot

Today a blip of green flashed across my timing signal. It's the first shade of green seen in a month, but I stopped trading long before that. If there is one thing I have improved upon in my trading it's avoiding the down turn and preserving capital. Having spent the past week going over my trades again looking for inconsistencies one constant has stood out repeatedly, giving too much back during down swings by trading through them and not having enough discipline to just step aside and let things work out. This time when my signals began to flip one by one I didn't wait for them all before stopping myself out of the market and sitting on my hands.

Suffice to say it's been frustrating being benched but instead of being demoralized by the thought that it may be weeks or months before the market aligns properly with myself I opted this time to put the energy into working on my weaknesses and spend more time improving my leaks and working on my analysis and planning, and process and method.

I also realized that I had reams of information scattered all over and that there was a lot of wasted effort and energy that could be streamlined so I started investigating Evernote and scoured Life Hacker and reading books about habit formation and modification to make critical changes to my trading plan. Instead of having notes flying around in journals and spread sheets and word documents I now have a central space to migrate the information so that is much more clearly presented, more easily accessible and mobile, and more focused and to the point.

Often there are things we know we do and wish to correct but the pattern is so ingrained we do so without thinking --habitually. We've heard the phrase “Practice makes perfect,” and Mark Minervini coined “Perfect practice makes perfect,” and I've gone a step further with “Perfect practice makes perfect permanent both good and bad. (completely pilfered from various sources)”  One of the patterns I wished to break was my improper use of a web browser. It is necessary when trading to have access to it, but one of my problems was I was perfecting and making permanent a bad behavior by distracting myself with sites I didn't need to view. I've known for some time this was an issue but never found a means to break the cycle since I had to use it, but how to wisely?

After checking out a Life Hacker book from the library I found my solution- site blockers. Now I have certain sites during certain times locked down and once they were no longer accessible I no longer even typed them in because I knew nothing would happen. Over night the input and stimulus that would other wise cloud my views, opinions and judgments, were dismissed because they were no longer accessible. Immediately one distraction that kept me from using my time more wisely disappeared and hopefully I'll instill a better habit of productivity and not avoidance of what I choose to be doing, but that's another life hack.

Thursday, June 7, 2012

Head Fake?

The theme the past 5 sessions has been not only a lack of follow through, but also a lack of participation. While yesterday's 2% move appeared strong on the surface the underlying buying was relatively anemic and the volume was subdued as well. The early morning gap today looked impressive, however it faded through the session closing near the lows as volume dropped off yet again. The lack of upside follow through has also kept the series of lower highs in tact thus far and has also kept in tack the lack of follow through in either direction indicating one thing clearly -a choppy market.

NASDAQ 06/07/12
Referring again to price action last year, two possibilities are Scenario 1 with a tradeable rally or Scenario 2 with a volatile whipsaw range may be in store for the Summer.

Trade or Range?
   

Underneath the surface the breadth the past two days has not been in keeping with the spirit of the move, with yesterday's 2.4% move coming in with less breadth than the 2.8% down move on 06/01 and today's continuation coming in extremely low.

Waning Breadth

Confirming this divergence, the 10 Day summation of this is near 0.

10 Day Breadth

The current bounce in view of underlying breadth should be viewed with suspicion until there is further buying confirmation.  Currently the market is in a moment of stasis in regards to short term breadth and considering the longer term view is still a down trend, these pauses are more likely the calm before the storm rather than a pause before rocketing higher.