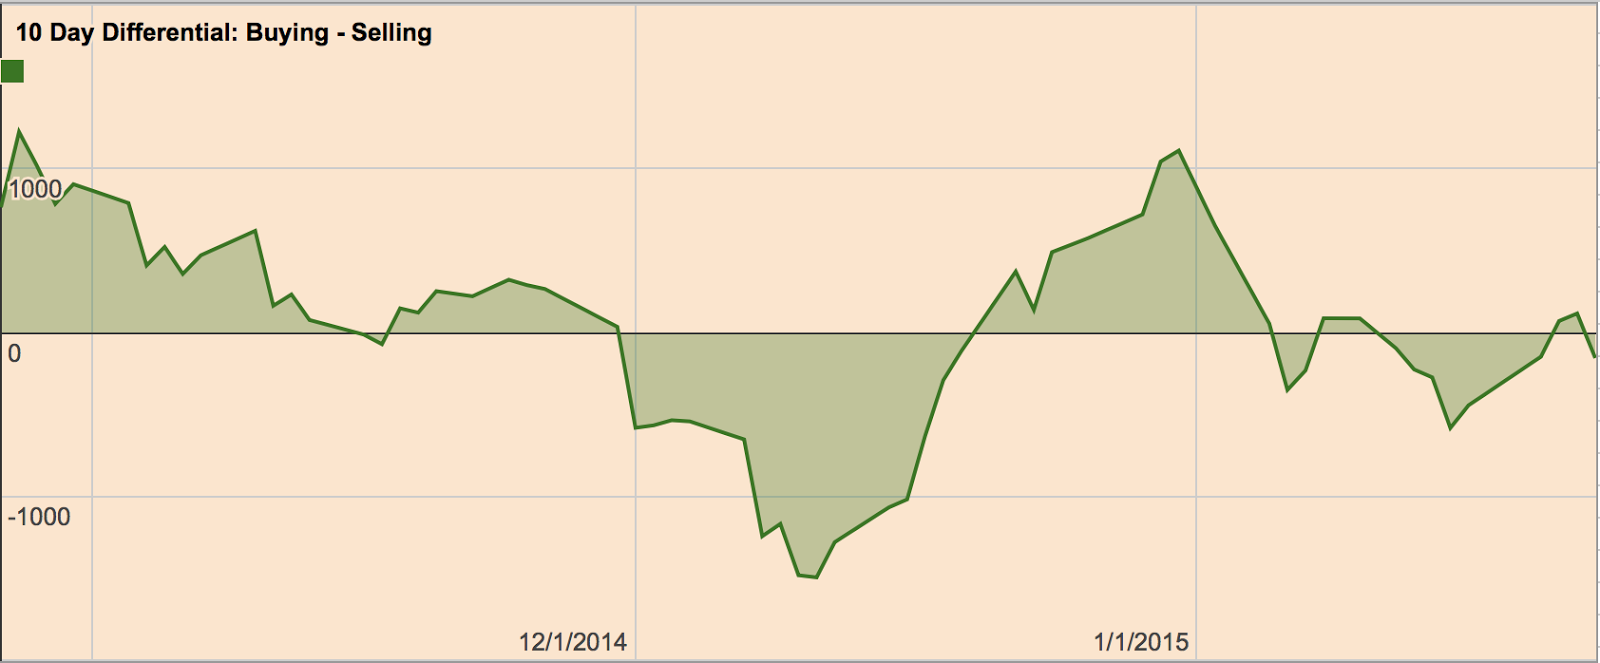
Breadth trends are still struggling and the lack of momentum in the general market continues to be an issue across multiple time frames. On a shorter time frame of ten days, less than 200 stocks are up my expected value. One positive is that on a 5 day time frame over 300 stocks have made moves of my expected value. What I would like to see is this continue into a higher time frame. Looking at the differential between 4% break outs to break downs, these are net negative ending the week indicating a lack of thrust.
 |
| 4% Break Outs vs. Break Downs |
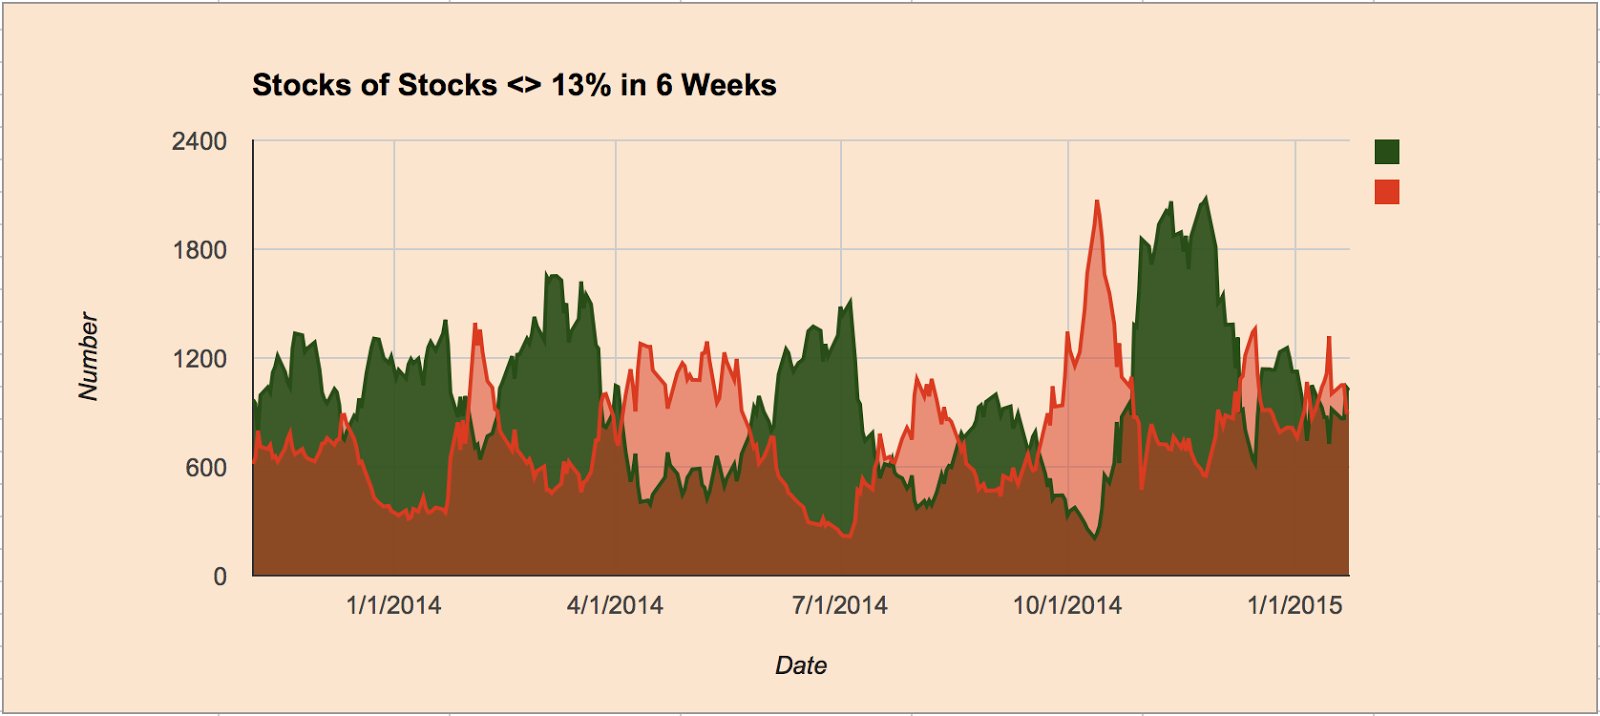
Moving to a higher time frame of 6 weeks, the number of stocks having moves greater than 13% vs. those less than 13% has had a negative crossover again.
 |
| Stocks <> 13% in 6 Weeks |
Moving to a 3 month period, theres continued waning of stocks with 25% or greater moves while those declining 25% or greater has been consistently high.
 |
| Stocks <> 25% Over 3 Months |
Looking at my focus stocks over the past week, while there has been some increase in a few of them, but the extent of the moves has been muted. The general lack of robustness in the overall market is effecting the post break out behavior and price expectations over my holding period. This makes for a difficult trading period when 1R losses are not balanced by 2R+ gains. Easy money isn't being easily acquired during this chop so my general attitude is less is more until there is a bid in the market vigorously increasing prices.
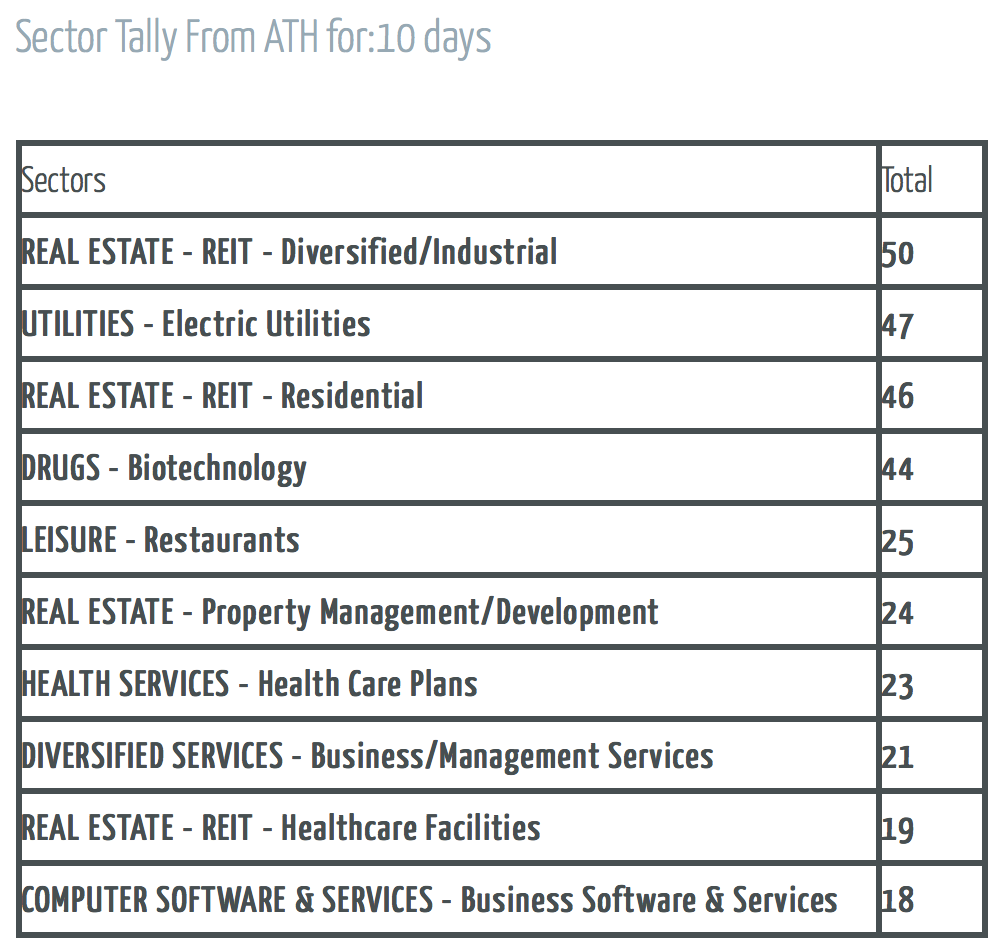
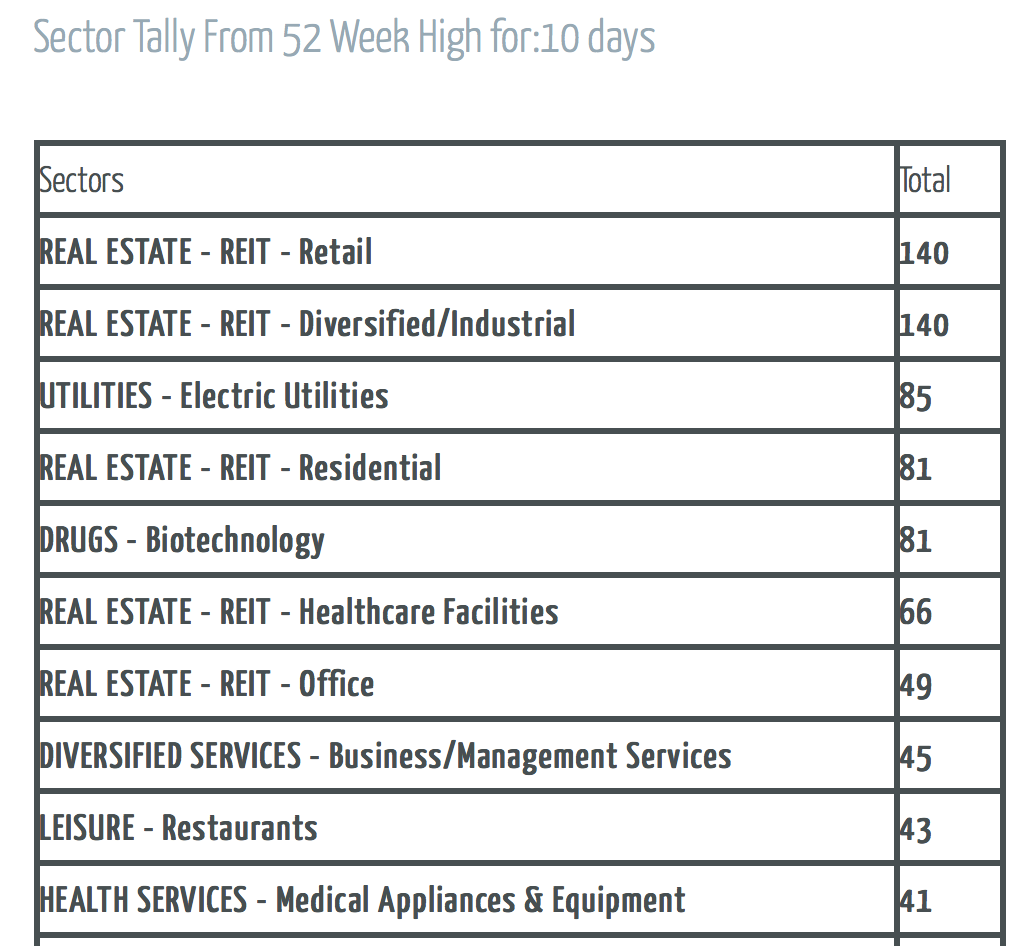
The major theme from sectors making new highs and all-time-highs continues to be dominated by REITS, but there are some other sectors beginning to emerge that might be worth investigating, such as Restaurants and Business Software & Services.
 |
| ATH Sectors 10 Days |
 |
| 52-Week Sectors 10 Days |
Three stocks that I will focus on through this week in anticipation of a break out:
 |
| ISIS |
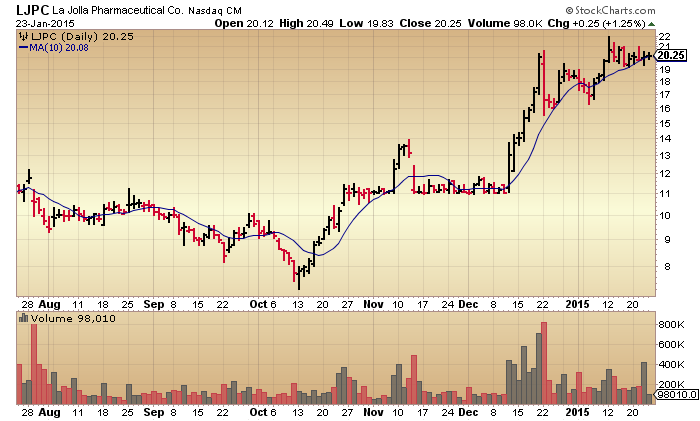 |
| LJPC |
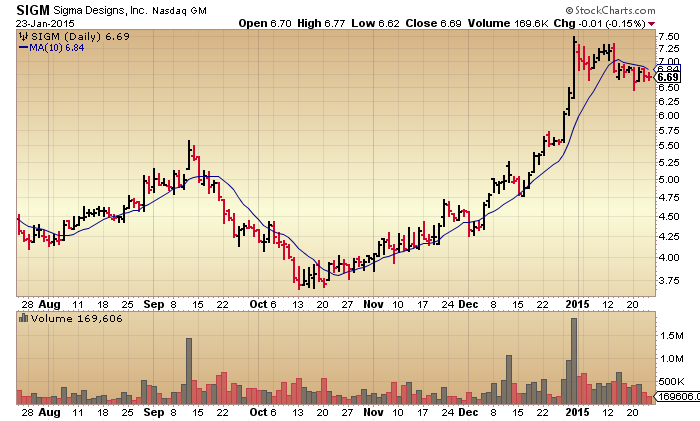 |
| SIGM |


