Sunday, April 6, 2014

Weekend Review April 05, 2014

There is plenty of evidence and documentation indicating the significance of paying attention to the price action of glamour stocks and stocks that allow the fat cats through the doggie door.  During this past week I came across a couple of concepts about assessing market health through high P/E stocks and decided to incorporate this with my analysis of stocks that allow size to move in and out.  I believe that coupling these approaches of market analysis can lead to better understanding of what is happening now via two categories of stocks informing of the general risk appetite, as well as the general sentiment of those who move the needle.  
Investors Business Daily focuses upon growth and their research indicates that growth stocks will typically correct 2x-3x that of the general market averages.  Additionally they have noted that some of the more notable stocks of the past will have a high P/E ratio in part due to the premium being paid based upon the perception of future earnings.  They document that, “These findings strongly suggest that if you weren’t willing to buy growth stocks at 25 to 50 times earnings, or even much more, you automatically eliminated most of the best investments available… In a roaring bull market, don’t overlook a stock just because its P/E seems too high.” HTMMIS 5th pg. 200-201.  When the future prospects of growth stocks become discounted, these beauty queens can rapidly turn into ugly ducklings, drawing down one’s capital like quick sand.  As a result, a significant draw down may result in the death of a trading account, or a prolonged struggle just to get one’s feet back on the ground and break even.
I tend to take a logical approach to my market studies in theory, and unfortunately an (at times) irrational one in practice.  Taking this information from IBD and developing a process of analysis from it the key points here are that the best winners of the past will be ranked above 25 to 50 P/E, and during a bull market there mere perception of future potential trumps current rational assessment of fair price and value.  In a weakening market, watching for signs that these runway models are tripping off the catwalk en masse can be valuable information and there are two publicly available tools that can assist us in this.  Using FinViz I created a simple scan: P/E High(>50), Price Over $10, and Average Volume Over 100K, then ordered by Performance Month for the following RESULTS
High P/E Screen

Recently I found a new chart software TradingView which allows one to create a basket of stocks as an index.  Using this scan I charted the first 10 from this list:
High P/E


The second FinViz scan I created was for Big Cap stocks, the type that allow size in and out. RESULTS
Big Cap Screen

Using the top ten from this list produces the following chart
Big Cap


Now that there is a simple process for breaking down high P/E and large cap stocks and creating a basket index of their performance over a Monthly/Quarterly time frame, the next step is to decide upon which questions are pertinent in order to make the data meaningful.  As a swing trader questions that I’m most likely to find of interest are: How are the high flying, darling, IBD type, growth stocks performing? Are the general market indexes showing strength while these stocks are correcting several multiples? Are stocks with high P/E showing positive monthly and quarterly performance or waning on one of these time frames? What types of stocks show up on a monthly/quarterly time frame that allow size in and out?  Are these stocks up on a shorter time frame more aggressive or defensive oriented?  What about the inverse, are those down more aggressive?  There is plenty of wiggle room to frame the market within our personal time frame and trading mentality, but first one must determine if this information is useful to begin with and applicable, otherwise it's just more disinformation in an already cluttered world of trading noise. 

Sunday, March 9, 2014

Weekend Review March 07, 2014

Put the needle on the record because it’s time to skip yet again.  The market on my time frame has become extreme and as such it is time to remind myself what 2013 conditioned me to do in these situations: Ignore.  For the most part I am in agreement
 with this if only because I see a number of stocks setting up and until this is no longer the case or the one’s I’m stalking begin to break down, being cautious during market extremes has not paid well.  This being stated, I’m not particularly adventurous at this stage and while I will look for opportunity when it comes around, my tactics and time frame have been modified under present circumstances.  For the time being I’m taking smaller size, faster gains, and less forgiving with my time stop.

Three of the breadth indicators I focus upon the most are currently running a high temperature.  On one of the shortest time frames I watch, the $MTMW reached rare air with a peak of 82% which has dropped considerably over the past few sessions to 74%. 

$MTMW


Worden’s T2108 has not peaked above the 80% level, but has been well above the 70% for a period of time now and this zone is often where pullbacks/corrections begin.

T2108


Last, the StockBee Market Monitor I follow is indicating a number of extreme breadth readings across multiple time frames.

Market Monitor


So, while I’m cautious here I’m still noting pockets of strength that are worth playing tactically until the market sets up better for more strategic positioning.  A few stocks I’ll be watching through the week are:

AER

AWAY

EXAM

LIOX

SNMX

Sunday, February 23, 2014

Weekend Review 02/21/2014

One of the characteristics for much of 2013 was the tendency of the general market indexes to be in lock step with each other.  There was a high propensity for V-Shaped bounces to make a marginal new high that was followed by a dip or digestion.  While there wasn’t perfect harmony, and outside of short windows where one would outperform, there was unison in that if one made new highs the others would follow shortly thereafter.  Since the January pullback and bounce the COMPQ has been the first to make a new marginal high, the SPX is within a whisker, and the $NYA, $RUT, and $INDU are still trying with the later two struggling slightly.  This may simply be a period of outperforming by two while the others play catch up, but if there isn’t unison in new highs, a change of market character should be noted.

COMPQ
$NYA
$RUT
$SPX

$INDU


Based upon what has been the norm since 2013 I’ve jotted down a few things to pay attention to in the near future.  1) Will the lagging indexes catch up and make new highs or will the leading draw down?  2) The SPX is in a zone where it churned from December through January.  It is a concern if this does not break and run through convincingly.  3) December and January are seasonally strong for small caps and they are now beginning to lag.  4) There are breadth divergences occurring.  Will they matter this time?

The breadth divergences that I have jotted down are the following:  The number of stocks in the NYSE above their 20 period moving average is in a zone where pullbacks or digestion zones occur.

$MMTW

The T2108 has been showing divergence with fewer stocks participating with each bounce:

T2108

The number of 100 day highs on the SPX has been diverging as well showing a divergence as fewer stocks participate.

SP % 100 Day Highs

This is also shown on the NYSE where the percentage of stocks at 52-Week highs has been steadily declining.

NYSE % at 52-WK Highs

I believe that we are currently in a stock pickers market, especially due to decreasing participation from a narrowing basket of choices. One of the focal points of my chart review session this week was newer issues that are setting up on the weekly time frame near their 10-WK MA or their all time high, as well as those that have gone up 100% from their low.  As the meat of earnings season is winding down and catalyst will be fewer, I suspect there will be some good risk/reward trades from many of these newer issues.

BFNT
SBGL
ADHD
CTRO
LEAF
STAY

Sunday, February 16, 2014

Weekend Review, February 14, 2014

Across the board the major indexes have undergone another V-shaped recovery with the COMPQ and SPX testing new highs while the RUT lags.  Whether this matters remains to be seen, but for the time being there's at least one chart with a head and shoulders pattern for one to hang their hat on.

$COMPQ
$RUT
$SPX

Going into this holiday shortened week I'm optimistic given the number of charts from my watch list setting up continuation patterns.  I return to bar charts from candlesticks yet again as I reevaluate my charts from the perspective of developing one's chart eyes (Kacher/Morales).  I tend to find that the patterns are simpler for me to perceive and I'm able to more quickly and efficiently identify the set ups I'm willing to trade.  This weeks bakers dozen:

AEIS
AER
APOL
ARAY
DHT
DXM
HZNP
SIMO
SMCI
TK
UCTT
VMC
CSII

On my time frame the market I trade looks healthy with a bountiful of opportunities to take advantage of.  Given the V-Shaped recovery it's important to avoid stocks that mimic the markets pattern and look for those that have consolidated in a sideways fashion.  One of the keys for me over the next week or two is the behavior of the indexes when they clip new highs as there has been a strong tendency for this to mark the end of the meat of the move before there is a pullback.  During these periods I've noted that the tactics used have more importance than the overall strategy and that while the later should not wag the dog, the prior are more subjective to the markets whims.  For myself that means more aggressive in profit taking and less forgiving of stocks that lack follow through within a few days of entry.

Thursday, February 6, 2014

Our Trading Data Lies to Us

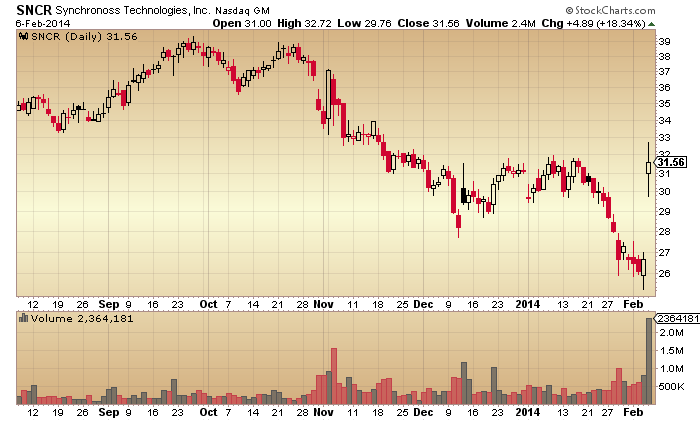
We are only as good as our data source and our data source is often inconsistent if not outright misleading.  I’m not 100% sure if realizing this earlier would have improved my trading but I understand it now much more vividly and it has altered my approach, especially in stock scanning.  One would think that the most simple of data points, a stocks float, would be constant across multiple providers, but it’s not.  Ex: SNCR- 18.2M from TeleChart, 34.4M from FinViz, and 21.15M from Yahoo.

What about volume?  Well, TeleChart’s volume is provided through BATS and often TC rounds, so 2.4M today, 2,363,466 from FinViz, and  2,364,181 from Yahoo.  And keep in mind this is just the known volume on the session and does not include dark pools so we can assume it’s probably much higher than any of these numbers. And Price?  Our charts deceive us here as not every price tick gets recorded and this results in the fact that the days high and low may not be accurate not only because of dark pools, but sub-100 lots will not register a tick on the end of day chart.

What about earnings? Today FLDM had earnings and ThinkorSwim has an estimate of -0.18 with an actual of -0.15. Briefing has and estimate of -0.13 and an actual of -0.04. Now I understand how analyst estimates can be site dependent, but the actual result should have no wiggle room what so ever.

Trading is a game of incomplete information and so is our trading data.  This can effect our entire trading plan from our vehicle selection and which stocks enter our universe and which do not based upon our scans as well as the criteria we use to build them.  This can effect our entry signals based upon which source has the most current and up to date information let alone the most accurate.  This can effect what type of alerts we use and what combination of criteria they are based upon.  This can effect how much we choose to micro-manage our trading.


What I’ve taken from this realization most is acceptance that there is an inexactness to trading and to release the tension of perfection in making sure I have the best candidates to trade. I no longer worry that I have the most precise entry requirements.  When price runs through an alert but it never triggers and I lose profit as a result of not exiting at my target or my stop runs slightly and my loss is larger, I’m much more at ease in letting it go.  In other words I’m learning remove precision, allow for sloppiness, and be OK with keeping it simpler.

Model Book February 06, 2014

Some recent additions to my watch list for the next three to six month time frame.
YELP
SNCR
PTEN
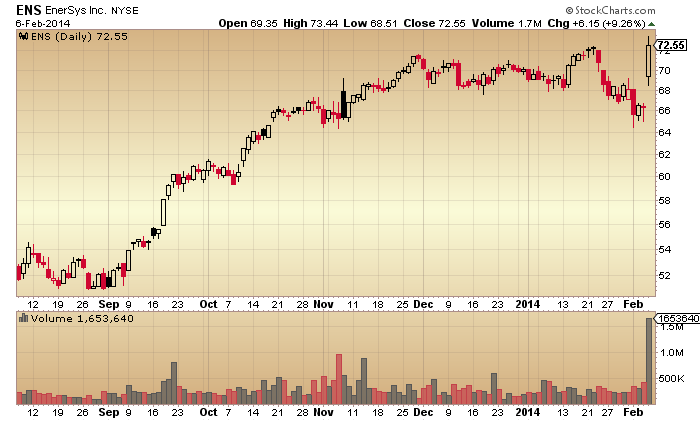
ENS

Saturday, February 1, 2014

Model Book January 31, 2014


On occasion even one of your favorite, long defunct bands, can surprise you with a gem you've never heard before. It got me thinking there must be a trading lesson in there somewhere, and maybe it's in my Pick-6 I pulled from one of my scans.

ARAY
MOD
MTW
SZYM
WYNN
ZYNGA