Are we beginning to see signs of panic? The NASDAQ just broke a pivot low that has held for 9 sessions and broke through a key psychological anchor, the 200MA. Additionally we're facing a transition from an orderly pull back into a deeper market correction now that the index has closed down 12% from the March high. Coupled with the magnitude of the move, down 2.8% for the session, a near term bounce would not be out of the question. Additionally, the anticipation of support in this zone and stabilization of price in this vicinity may lead to the belief that a bottom may be forming here, however evidence indicates that this view may be premature.
To hone in on the underlying market psychology and where it registers in terms of panic, one tool available to help gauge this is the Justin Mamis Sentiment Cycle as illustrated here from Wall Street Cheat.
 |
| Market Cycle |
Using this and overlaying the conditions upon the NASDAQ, the current location of market psychology as depicted through this model suggest that the initial stages of panic may be on the horizon.
 |
| Market Cycle Overlay |
Further, when it comes to sentiment indicators there continues to be a divergence between the Pros Vs. Joes with the Investor Intelligence Sentiment currently reading 24.5% bearish with a 1% increase in bullishness over the previous week while the AAII Sentiment currently shows a 42% bearish reading with a 2% decrease in bullishness. There is plenty of indication that retail and hence weak hands have left the market already while those in position to make markets move have held fairly steadfast.
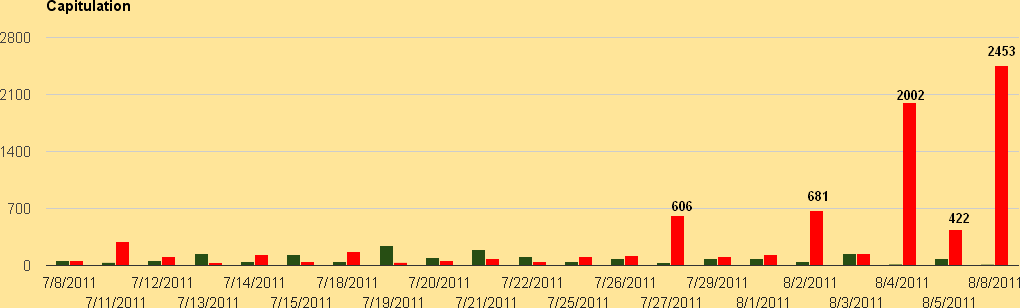
When addressing what is or is not panic, moves in the indexes can be deceptive. One way to reduce the noise of wild intraday market swings is through assessing the underlying market breadth in relation to these swings and quantifying and modeling what a panic/capitulation scenario looks like. For this, I use the number of stocks that have increased or decreased by 4% or more on increasing volume from the previous day. Using this criteria and reviewing the numbers in 2011 allows for panic to be depicted visually. What this chart shows is that prior to the flush when there was a rush to the exits the number of stocks decreasing by 4% on increased volume from the previous session hit very high numbers as there was a stampede to exit.
 |
| Panic Selling |
Comparing this to now there are a few nuances. The most obvious is that there are a number of days that had larger selling and that this selling has been persistent over the past few weeks. At first the selling was not remarkable for there were only 2 days above the 300 threshold, but over time it becomes and added together there was orderly distribution occurring during this period that was significant, but not yet panic. With a 500 day now occurring, this may be the initial stages of exiting at any cost exemplified through deleveraging and margin calls as bids dry up and no buyers are to be found and prices rapidly depreciate and shorts smell blood in the water.
 |
| Persistent Distribution Sans Panic |
The USHL also depicts what a panic/capitulation scenario looks like as the numbers drop to -3000+. Currently it is at -271 which by no means is an extreme bottom formation reading suggesting that even though there has been orderly exiting a number of stocks have still held up well. As long as these stocks hold up well, the indexes in turn will mask the broader weakness under the surface until they in turn can not longer find bids, selling hits the tape and shorts begin to look for new targets. When markets deteriorate few stones are left unturned so there is plenty of kindling left to add to the fire.
 |
| No Panic |
Currently the market is not particularly healthy and volatility is on the rise and a number of conditions for a flush are being met so this is one scenario to be anticipate. Regardless of whether this move ends in panic and capitulation or merely through distribution until there is no one willing to hold up bids remains to be seen. The importance isn't having this play out exactly as anticipated, but merely being aware of and prepared with contingency plans based upon probable outcomes and scenarios.
No comments:
Post a Comment