I don't get giddy often, but when I do
I'm mindful to dismount the high horse and put my feet firmly on the
ground. I've been up the ladder and down the chute enough times now
that I'd like to believe I've wizened up to the fact that I should be
cautious under such circumstances. It has been during these moments
that I've managed to cough up my profits the fastest and find myself
at scratch and starting all over again. There's plenty of reason to
remain positive about the overall market, however right now is the
time to be cautious from my perch and being happy with my results is
one of the first signs.
There's two things in my trading that I
try to achieve: avoiding draw downs and avoiding troubling market
periods. To better asses the later I continue my daily process of
breadth analysis even though I must admit that this trading year has
been a bit difficult in this regards as there have been a number of
false signals given from my readings as well as some false
assumptions and poor analysis on my part. Be that as it may,
what this has illustrated much more clearly to me and I have to to
greater acceptance of, is that not everything works all the time.
I've been fooled and foolish over the past 9 months, but what has
been further cemented is sticking to my process and not the outcome.
Part of my process continues to include
the following check list:
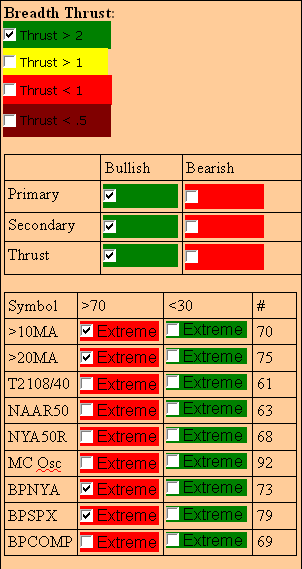 |
| Breadth Check List |
Working from the top down I gleam the
following information: the Primary, Secondary and Thrust are all
bullish here. When these are aligned they tell me very simply that
long is the correct side of the market and in turn so should my bias.
However, this is not a simple hot/cold scenario. The underlying
numbers are also important. The following spreadsheet image
backtracks from today through July 29th (dates not shown
due to screen real estate).
 |
| Market Montior |
The numbers that are of most interest
to me are the number of stocks in my universe up/down 4% daily, the
number that are up/down 25% in a quarter, and the number that are
up/down 50% in a month. What the underlying numbers illustrate is
that over the past few days there is a similarity to the readings
from late July through early August where the market stalled out,
volatility began to increase, and a modest pullback ensued. So while
all elements are aligned and my longer term bias is long, in the
short term I am leaning somewhat bearish and as a result am cautious
about the current state of the market.
Moving down the list I have a number of
public canned breadth indicators that I follow. The first two are
the % of NYSE stocks above their corresponding 10 and 20 period
moving average, both of which are above 70 and I consider that an
extreme zone. What this indicates to me is that on the shorter term
the market breadth is very stretched here and exhausted and in need
of rest. The T2108 which is the number above their 40 period moving
average is at a more modest 63, but intraday this reading clipped
above 70 two sessions back. The next two are the % above their 50
period moving average on the NASDAQ and NYSE.
 |
| T2108 Intraday 70 |
In conjunction with an intraday reading
of 70 on the T2108, the Mcllelan Oscilator clipped a very extreme and
rare 300 reading before quickly snapping back and on a closing basis
ending the week at 93 indicating that some of this exuberance has
been tempered.
 |
| T2106 Intraday +300 |
Looking at the $BPNYA, $BPSPX, and
$BPCOMPQ it can be seen that these are at extreme readings of 73, 79,
and 69 respectively. I believe what is also noteworthy about these
three breadth indicators is that there has never been a significant
enough pullback over this trading year to pull these readings below
70 for very long. That these readings have remained elevated above
70 for much of the year with the exception of the $BPCOMPQ which
lagged early, it's been clear thus far that the signals from them
have been less than reliable and better left out of the analysis
picture all together.
 |
| $BPNYA |
 |
| $BPSPX |
 |
| $BPCOMPQ |
So now that I have a picture of the
landscape I'm traversing upon, the next step is to bring it all
together for a game plan going into next week. For this I have a
series of questions such as: where are we in the longer term scheme,
what is the predominant theme (growth, turnaround, value, junk,
sector), what are the breadth trends indicating, and what scenarios
should I plan for over the next 5 days.
Ultimately the answer to these
questions is somewhat illusory, but the main point I try to focus
upon are the two aspects of my trading I mentioned at the beginning:
limiting draw downs and trying as best as possible to participate in
a market that works with me on my time frame. So for this week I'm
going to approach the market with caution and observe how Monday
plays out and what tone might be set for the remainder. From a swing
trading perspective I think it's best to wait for some clarity and
not push marginal edges here. As it stands I have two outstanding
positions at full risk, 2% of my account, and the others I hold have
break even stops. I have taken myself off of margin going into the
weekend due to a time stop and profit target exit and am comfortable
with current account risk and see little reason to add to on Monday
or Tuesday.
I know from experience that when I
start pushing the pedal here I tend to have too many positions open
with out enough profit buffer to reduce risk exposure and find myself
subject to pull backs and 5-6%+ draw downs. Opening up a new swing
this week under the current market conditions based upon past
experience would result in a higher probability of being stopped out
due to the breadth being extended on the shorter term time frames or my own negligence is taking on too much risk. With earnings season in a couple
of weeks there will be plenty of catalyst based stocks to
build a watch list for the next three to six months, so patience
until then is prudent.
No comments:
Post a Comment