Saturday, June 1, 2019

Selling In May

During the month of May stocks have been under distribution with 50% of the trading days showing more 4% break downs than break outs.  

Distribution
The weight of this distribution is clearly seen with the number of stocks making new highs eclipsed by the number of stocks making new lows over multiple time frames.  However, the pressure on stocks has been evident going back to March.   

Highs Over Lows

When the market correction reversed in late December stocks underwent a significant breadth thrust over a short period of two months.  From that moment further the major indices continued to make fresh highs with underlying divergence in both the number of stocks making new highs and making significant headway.  Market risk was increasing until the dam broke in May.

Decreasing Breadth

With the major indices down approximately 7 to 10% across the board, it's time to focus on a tradeable rally.  The number of stocks below both their 20 and 40 period moving averages are approaching zones where in the least a reflexive bounce is to be expected if not the potential for another leg up.

Stocks > 20% MA

T2108 > 40% MA

On a longer time frame, the current pullback has brought individual stocks in my trading universe back to levels of the December turnaround.  It's uncommon for stocks within my universe to reach these levels further buttressing my belief that the probability this downdraft running out of steam is near.  On the other hand this period could also be like October 2018.  In either case knowing what data and information one is looking for on their time frame to indicate where the market is directional moving over it is the primary determinant factor.

2 Year Breadth Trend


Monday, May 13, 2019

Market Volatility and Stop Placement

Directional price burst is the swing traders friend.  Non-directional and/or choppy price action is a swing traders nemesis. Volatile price action marked by wide intraday swings and gaps against positions is a swing traders potential downfall.  One can often determine the later period when well intentioned traders offer the following advice:  "Trade small or not at all", or "If you're going to trade this market widen stops."  Is widening stops a viable strategy when there is an increase in volatility or is it dubious and best to avoid?  

Suppose there is a hypothetical trader with the following stats.  Said trader has an average stop of 6% from entry with an average gain of 12% and a 55% win rate.  Over a series of 10 trades the expectation is $650 per trade.

Trader Stats

Now suppose said trader adjust their stops to account for loosening price action.

Widen Stop

Simply adjusting the stop by an additional .40 results is a decrease in profit per trade of $440.  It cannot be assumed that this trader who has a history of 12% gains on a trade by trade basis will suddenly turn them into 20% thus balancing out for the wider stop.  However, it can be and should be assumed  that the win percentage will not remain the same.  Adjusting this as follows and suddenly a profitable trader is a losing trader.

Widen Stops/Decrease Win %


But, this is actually factoring in the best case scenario.  What if there were a string of losses greater over the next ten trades instead of an on average series of gains/losses?  When plugging these numbers into a risk of ruin simulator, over the next series of ten trades, said trader has increased the probability of a 5% draw down significantly.


For swing traders, the current market conditions can be summed up as follows.


When market conditions become like firing into a hurricane, it's safe and sane to step aside and stop trading.  Widening stops will likely lead to losses of hard earned gains and/or underlying capital.

Monday, April 15, 2019

Returning to a Market of Stocks

The past 6 months have illustrated a delineating characteristic between a market of stocks and a stock market.  One metric that bears this out is the percentage of the universe I follow being up/down 25% over a 3 month time frame.

Transition Phase
What this highlights is that within the past 6 months there has been a higher correlation between stocks moving in one direction and just as quickly moving in the other.  Prior to that there were 18 months of a fairly static range where these numbers oscillated but didn't fluctuate much.  From a lower correlation market of stocks there was a transition phase into a high correlation stock market which is now beginning to compress again.

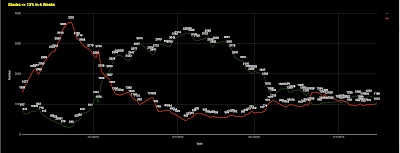
This compression is highlighted on a lower time frame of 6 weeks.

Compression
Market moves over a 6 week time frame have been compressing and this is evident chart wise on a number of stocks that have been mostly flattening over this time period.

The number of new highs and new lows over this period has also shown compression near a zero base with ticks above and below on the longer term time frames.  There has been some fluctuation on the shorter periods but no significant directional burst.  Each time there looked to be it pulled back in.

New Highs/New Lows

Sunday, March 10, 2019

Weekend Review 03/10/2019

The underlying structure of the indices makes it improbable for them to undergo a high momentum phase.  If they do it indicates the underlying buying  is not only broad based, but demand is exceptionally high resulting in rapid price appreciation over a short period of time.  These periods are not sustainable and tend to result in sharp pullbacks.  This past week the major market averages have pulled in, but not enough for all them all to unwind.

SPY Exits High Momentum Phase
COMPQ High Momentum Phase

The selling pressure over the past week has inverted new highs to new lows across multiple time horizons.  


New Highs - New Lows


The number of stocks above their 20 period moving average has unwound to a level where it is becoming extended to the downside.

%Stocks > 20 Period


T2018
T2108, the percentage of stocks above their 40 period moving average has unwound from extended levels and pulled back to ~50%.

Of note is that the number of stocks that have made moves of greater than 13% over 6 weeks is close to flipping.  It will be worthwhile observing if this hits higher time frames.

Stocks > 13% 6 WKs

Currently I'm approaching this as a pullback within an aggressive breadth thrust.  I expect a pause as new setups emerge.  Until things firm this is a risk management market.  Being attune to when stocks stop making new lows across multiple time horizons and when buyers step back in will be a primary focus.

Thursday, February 28, 2019

Extreme Momentum on the Indices

It is uncommon for the major market indices to show up in my momentum scans.  It's rarer still when they all do.  The tendency thereafter has been a sharp pullback. 

IWM Momentum Phase
NYSE Momentum Phase
QQQ Momentum Phase
SPY Momentum Phase


After spending a lengthy period of time elevated at extended levels, the % of stocks above their 20 period moving average dipped below 70.

% Stocks > 20 Period MA
 
On a higher time frame and also after an extended period of time at elevated levels, the % of stocks above their 40 period moving average has also declined, but not significantly enough to drop under the 70 zone.

T2108
These are the periods when a prudent speculator may want to consider transitioning from trader to risk manager.  The lock out rally has been forgiving, maximum adversity may not be so.

Monday, February 25, 2019

A Tail of Two Extremes

% of Trading Universe <> 25% in a Quarter

For nearly two years the percentage of stocks above/below 25% over a three month period remained fairly consistent with a ceiling of approximately 20%.  Beginning October through December 24th the percentage of stocks down 25% clipped 50%.  Two months later this has almost completely inverted with the percentage up currently at 45%.

Friday, February 22, 2019

Avoiding Extended Stocks

PYX


One of the crucial fundamentals of swing trading is avoiding extended stocks.  But what qualifies as extended and how can one quantify that?  In some cases it is transparent.  PYX is one such example which is up over 100% within a 30 day frame.  When things aren't so clear what is an extended stock may be answered with, it depends.


Frequently attempting to quantify relationships in trading is a chicken/egg scenario that may end up quaking like a duck.  Attempting to find a hard and fast rule to define extended stocks may lead to a dogmatic assessment of the information provided by a stocks price action.  As with many trading questions, it is better to look inward than outward for solutions to this problem.


Suppose one’s metrics show an average holding period of 5 days and an average position gain of 8% over that time horizon.  Within these parameters a stock up 10% over the past 5 days already exceeds one’s avg. gain over holding period.  Under differing parameters this may not be extended at all, but within the prism of one’s actual results this may qualify.  Taking this trade would be under the expectation that price appreciates 20% within a 10 day time period.    At the time of this writhing there are 107 stocks above $5 with daily volume of 100K that are up 20% over 10 days.  Not only would the hypothetical trade exceed what one’s metrics show, under current market conditions it may also be a low probability.

Knowing this, scanning for stocks that have not had a significant move over one's average holding period will lead to stocks that are not extended.

CHRS


Another technique is to remove price entirely and look for flattening price zones using a MA that makes sense for one's holding period.

CHRS 10-Period MA

Metrics based analysis helps take the guess workout of what is or is not extended.  Using one's data and stats as the floor from which to build one's trading foundation will lead to actionable information.  Coupled with analysis of how the market is structured and behaves will help build out the frame.